

Question: D Click Submit to complete this assessment. uestion 19 8 poin Below are the real data of the Nasdaq and the Bitcoin over a
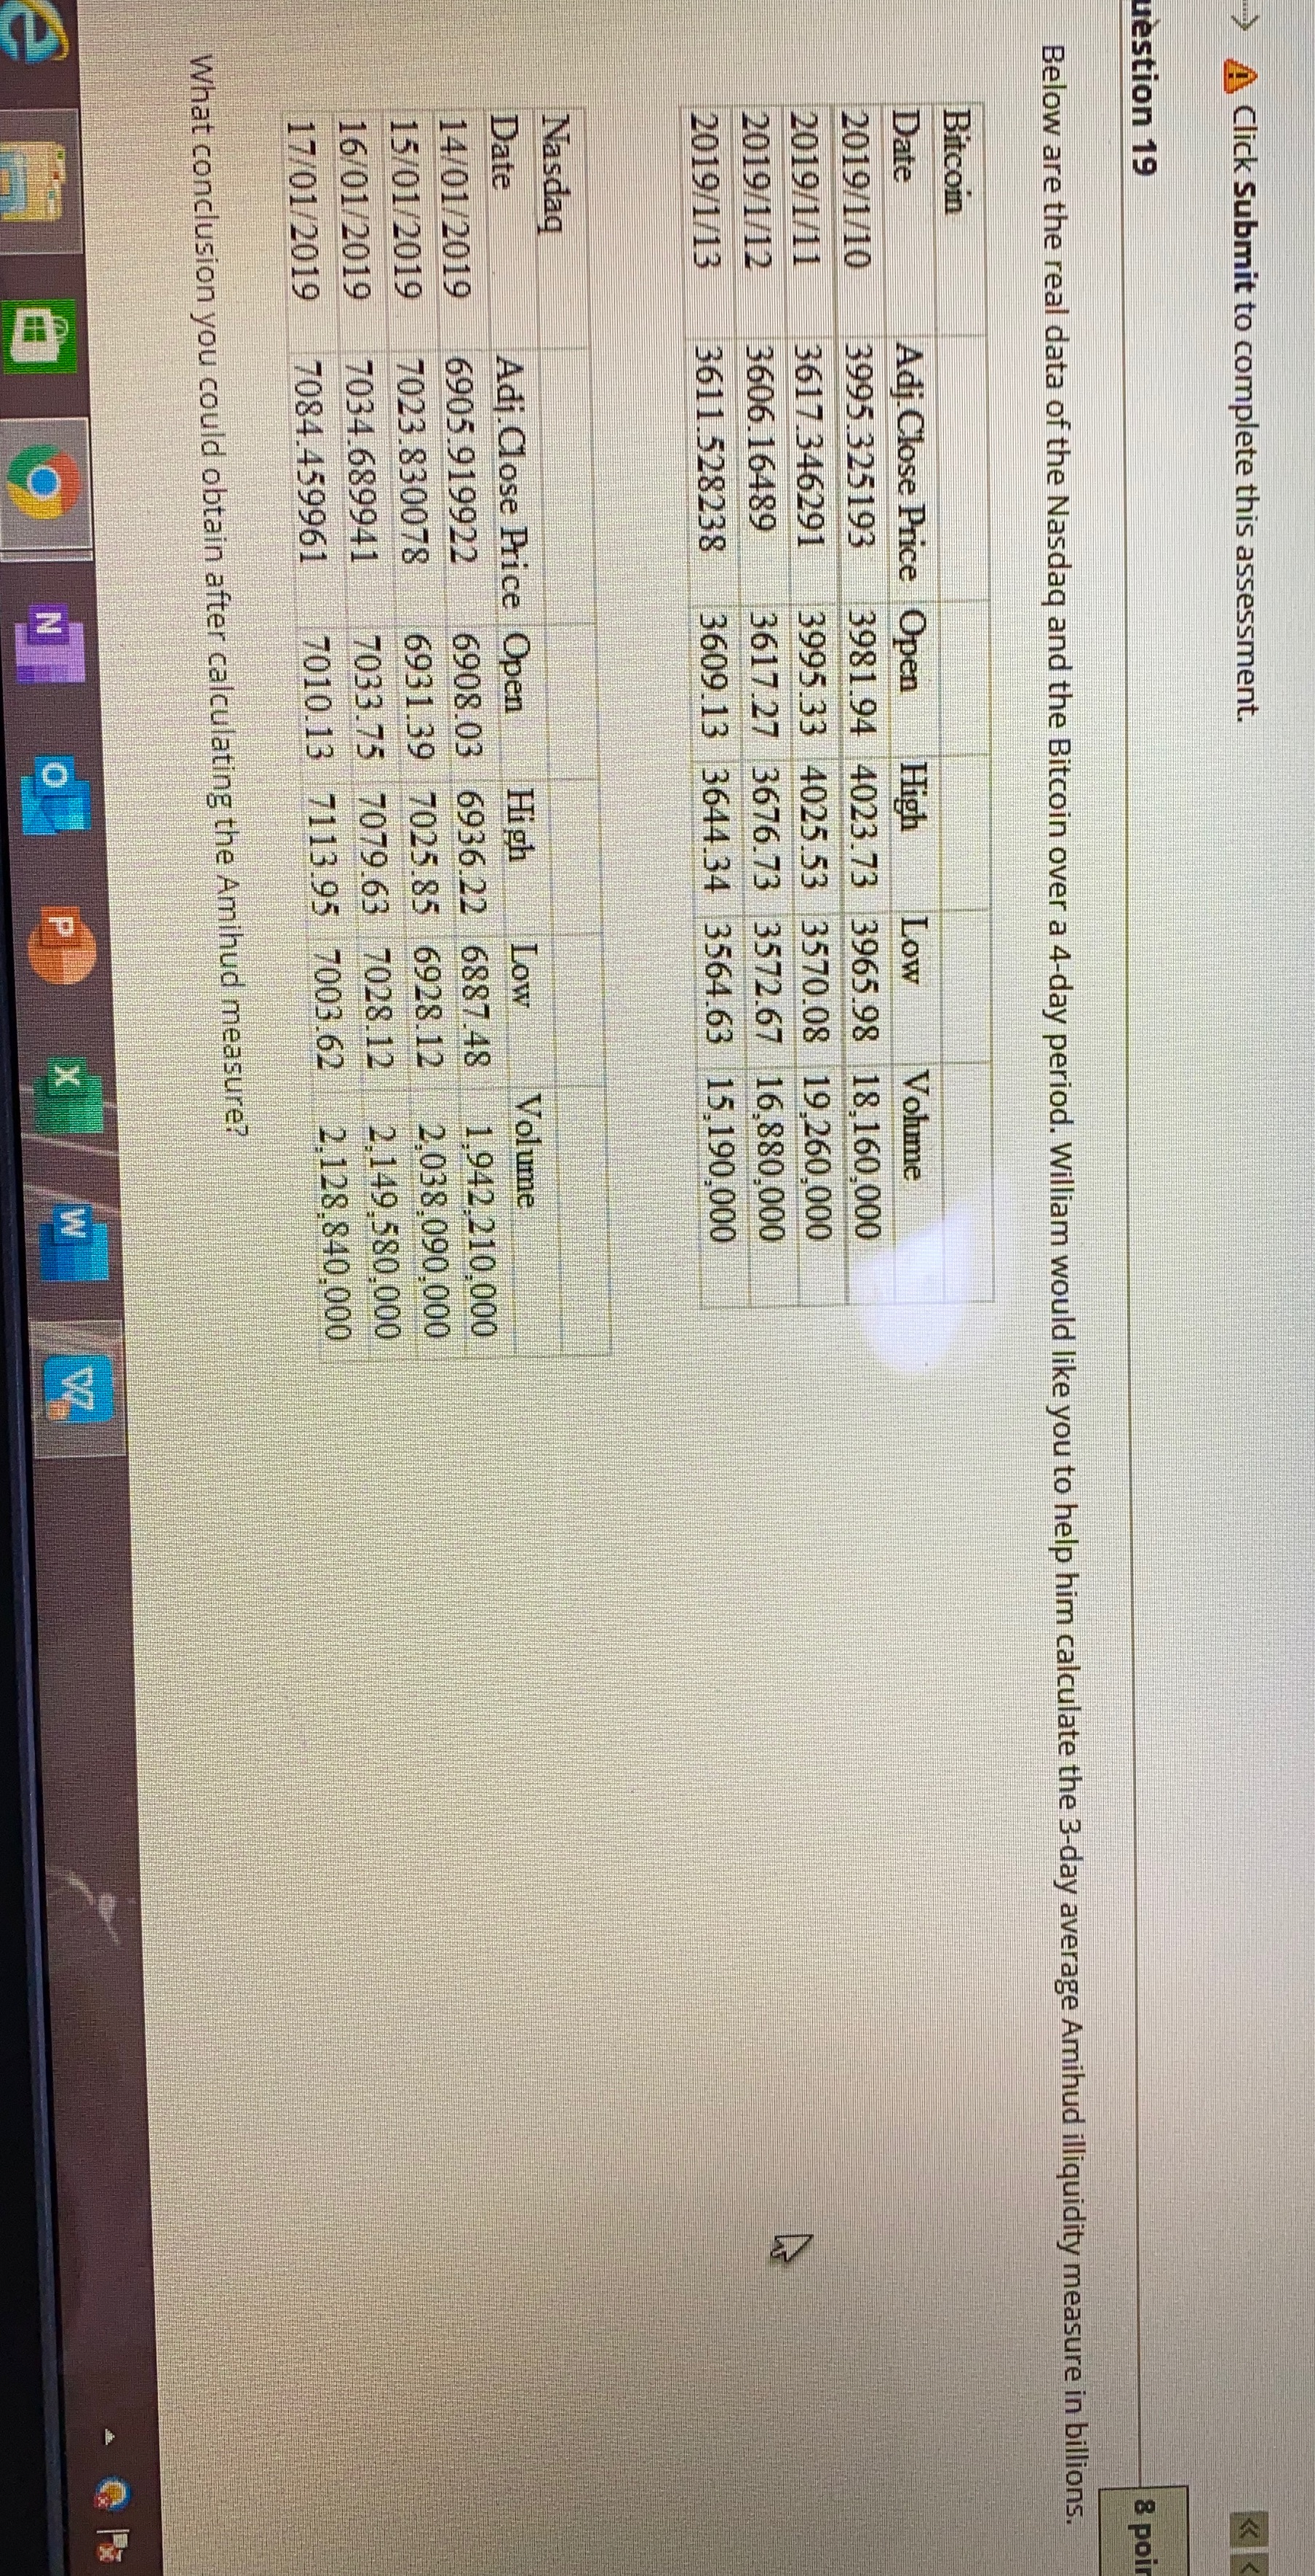
D Click Submit to complete this assessment. uestion 19 8 poin Below are the real data of the Nasdaq and the Bitcoin over a 4-day period. William would like you to help him calculate the 3-day average Amihud illiquidity measure in billions. Bitcoin Date Adj Close Price Open High Low Volume 2019/1/10 3995.325193 3981.94 4023.73 3965.98 18,160,000 2019/1/11 3617.346291 3995.33 4025.53 3570.08 19,260,000 2019/1/12 3606.16489 3617.27 3676.73 3572.67 16,880,000 2019/1/13 3611.528238 3609.13 3644.34 3564.63 15,190,000 Nasdaq Date Adj.Close Price Open 14/01/2019 15/01/2019 7023.830078 16/01/2019 17/01/2019 6905.919922 6908.03 7034.689941 7084.459961 Low High 6936.22 6887.48 6931.39 7025.85 6928.12 7033.75 7079.63 7028.12 7010.13 7113.95 7003.62 Volume 1,942,210,000 2,038,090,000 2,149,580,000 2,128,840,000 What conclusion you could obtain after calculating the Amihud measure? N X W W
Step by Step Solution
There are 3 Steps involved in it

Get step-by-step solutions from verified subject matter experts