

Question: d. Develop a crosstab report in Microsoft Access, using a 3D bar graph to show orders by product and by department. (The sample output is
d. Develop a crosstab report in Microsoft Access, using a 3D bar graph to show orders by product and by department. (The sample output is shown in Figure P13.3.) 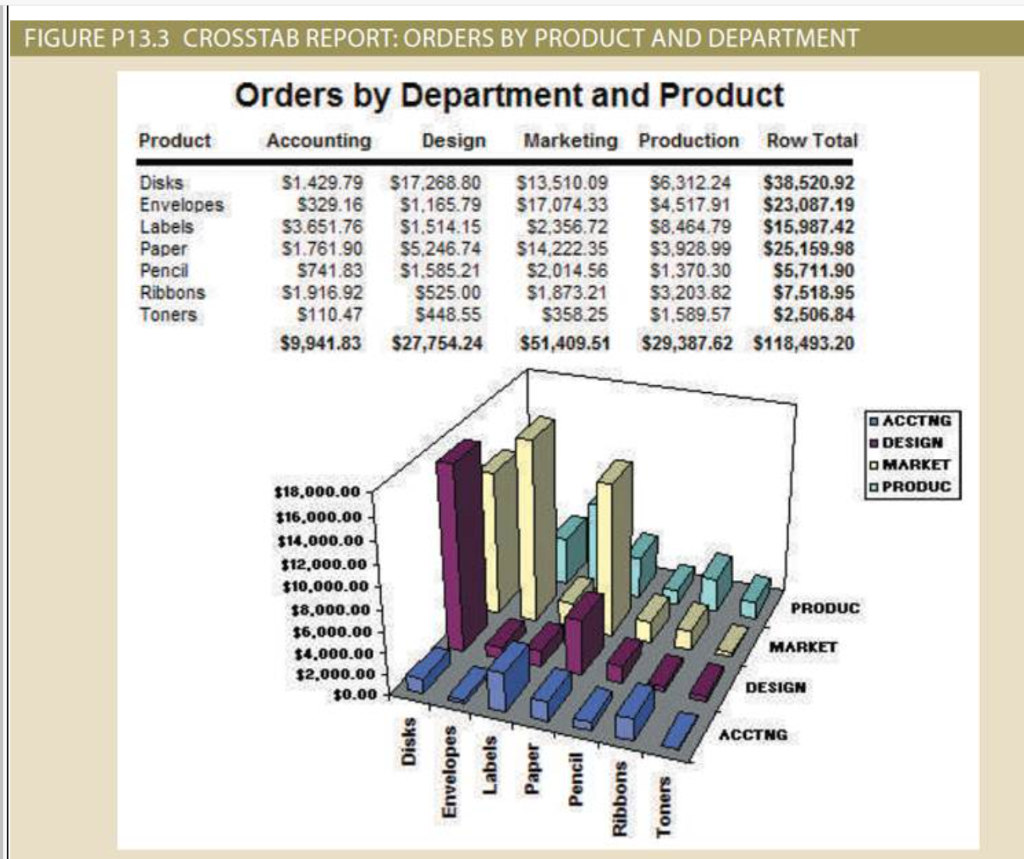
| Product | Accounting | Design | Marketing | Production | Row total |
| Disks | $1,429.79 | $17,268.00 | $13,510.09 | $6,312.24 | $38,520.92 |
| Envelopes | $329.16 | $1,165.79 | $17,074.33 | $4,517.91 | $23,087.19 |
| Labels | $3,651.76 | $1,514.15 | $2,356.72 | $8,464.79 | $15,987.42 |
| Paper | $1,761.90 | $5,246.74 | $14,222.35 | $3,928.99 | $25,159.98 |
| Pencil | $741.83 | $1,585.21 | $2,014.56 | $1,370.30 | $5,711.90 |
| Ribbons | $1,916.92 | $525.00 | $1,873.21 | $3,203.82 | $7,518.95 |
| Tonners | $110.47 | $448.55 | $358.25 | $1,589.57 | $2,506.84 |
| $9,941.83 | $27,754.24 | $51,409.51 | $29,387.62 | $118,493.20 |
FIGURE P13.3 CROSSTAB REPORT: ORDERS BY PRODUCT AND DEPARTMENT
Step by Step Solution
There are 3 Steps involved in it
1 Expert Approved Answer
Step: 1 Unlock

Question Has Been Solved by an Expert!
Get step-by-step solutions from verified subject matter experts
Step: 2 Unlock
Step: 3 Unlock