

Question: D. Discuss the ownership structure of MIPS, with focus on how the ownership structure may affect the value of the company. See file Ownership Structure
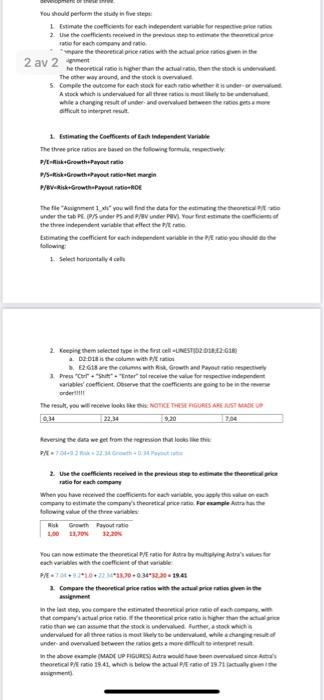
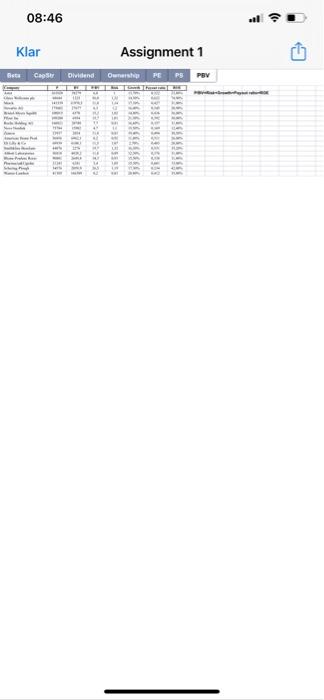
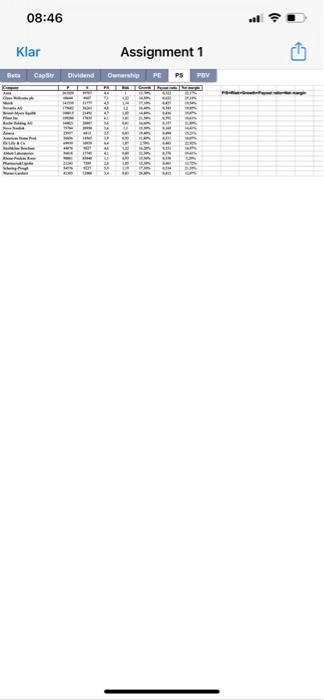
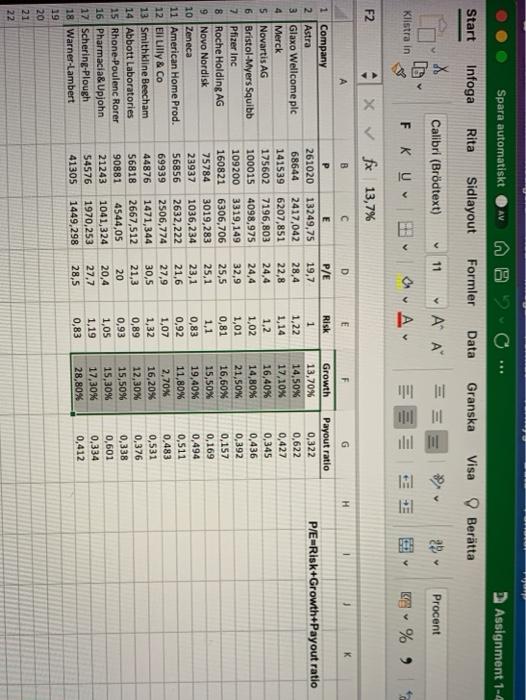
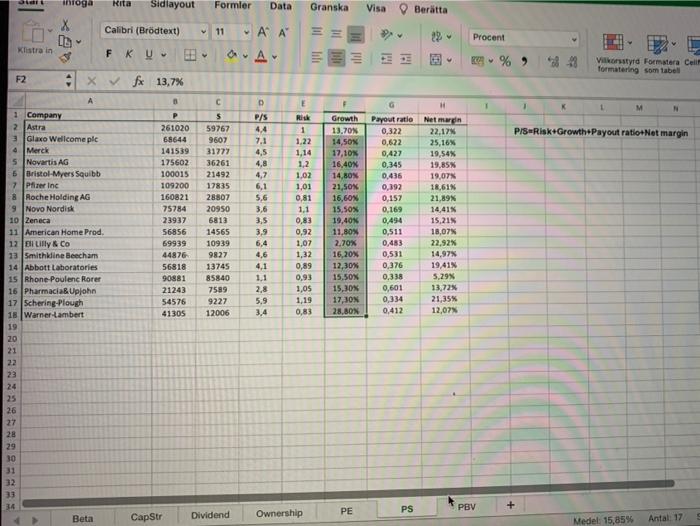
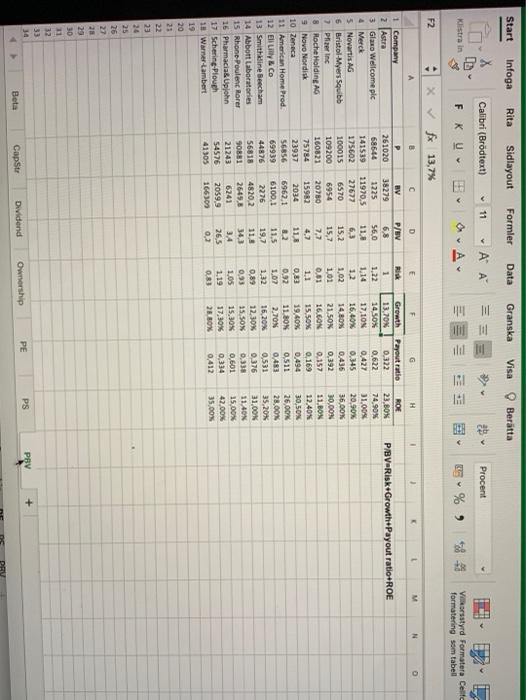
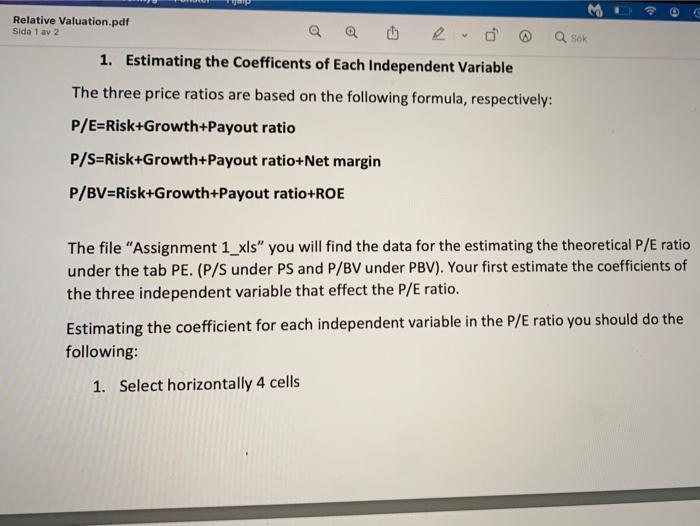
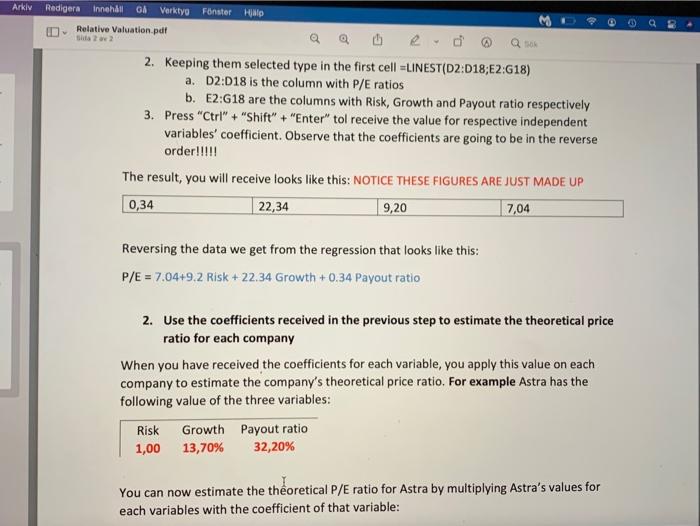
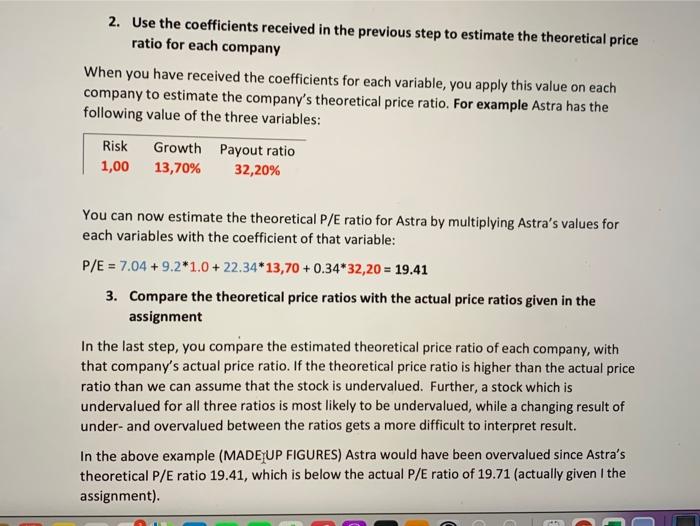
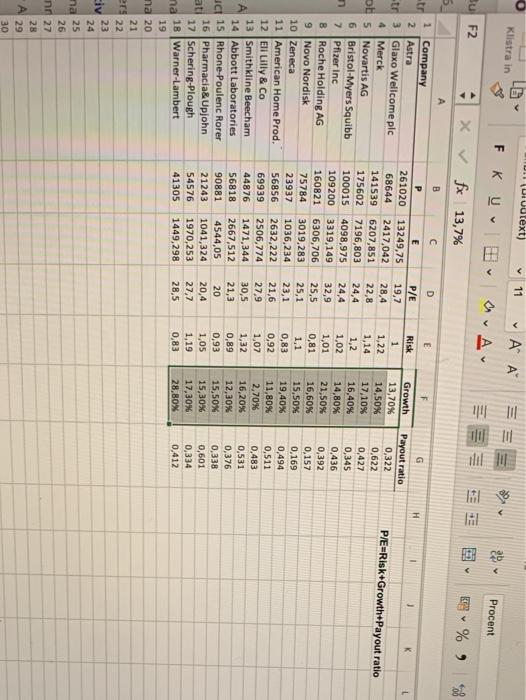
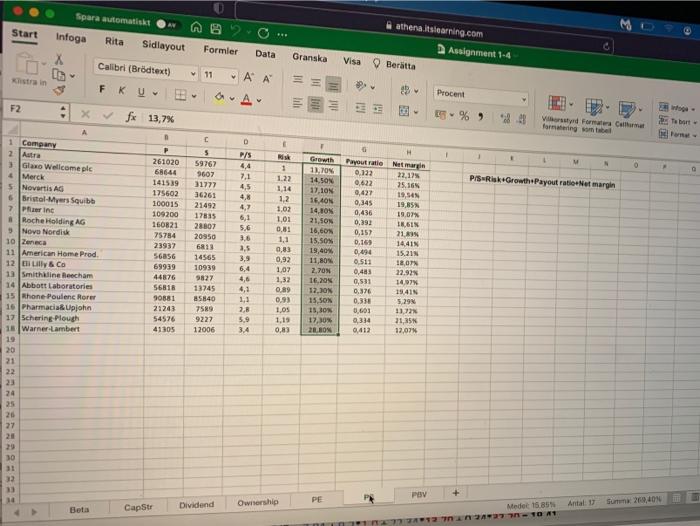
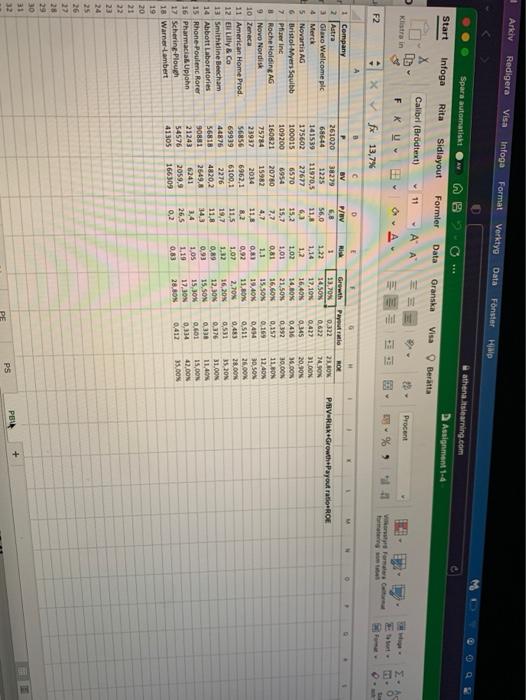
You should perform the stay in five step Estimate the coefficients for each independent for respective price 2. the conficients received in the previous post ratio for each company andro mpare the theoretical price rates with the actual price rates gan in the 2 av 2 he theoretical vatios higher than the actual rutia, then the stock underhet S. Compile the outcome for each stock for each rate whether is under-areena A stock which is undervalued for all the ratio soy to be understand while a changing resultet under and overvalued between the respeto stficult to interprete 1. Estimating the Coefficents of each Independent Variable The three price ratios are based on the following for respectively p/BiGrowth Payout ratio WysokGrowthout the margin P/BvRisk Growth Payout ratione The legent 1x you will find the data for the estimating the heart under the tab / under and under POV Your first estimate the confidents of the three independent variable that affect the /rati Estimating the coefficient for each independent variable in the Prato you should do the Select horontally 2. Keeping the selected top in the first cell UNES 02.01.2018 Dos e column with tation E2618 we the comes with Growth and Payout ratio respecte 1. Pre Cor" "Shinter to receie the value for respective independent variables coefficient. Coser that the coefficients are going to be in the order The result, you will receive books NOTICE THESE GURES ARESTADE 22,34 9.20 Reversing the data we from the regression that looks like the 2. Use the coefficients received in the previous step to estimate the theoreticale ratio for each company When you tuve received the coefficients for each variable, you the end company to estimate the company theoretical foresample owing use of the three variable Mis Growth Payout ratie 1.00 11.70% 12.20 You can now estimate the theoretical Pratio For Araby multivitas each variables with the coefficient of that are PE02.0034220-19.45 1. Compare the theoretical price ratios we the actual prioratie pre assigned in the lates, you compare the estimated theoretical price of each.com that company's actual price rate the theoretical price right there ratio than we can assume that the stock is undervalued further, a stack which undervalued for all three mais la mot to be under while changes of under and overvalued between the ratios gets a more difficult to interpret result In the sbove example MADE U FIGURES Rtra would have been die theoretical p/ ratio 29.41, which is below the actual P/Est of 29.7 cm 08:46 al Klar Assignment 1 Cap Dividend Ownership PE P 08:46 Klar Assignment 1 Caps POV Dividend Owner PC IHI 08:46 Klar Assignment 1 PS PBV Beta CapStr Dividend Ownership PE Horrom HT Wampe WENN CH 364 100 IR LO 203 3 NA 31341316 Shaha STRA L RI Spara automatiskt AV Assignment 1-4 Start Infoga Rita Sidlayout Formler Data Granska Visa Bertta 11 ' 29 Procent Calibri (Brdtext) FK U Klistra in V a. Av E K% ) F2 Xfx 13,7% B D E F G H 1 Risk P/E-Risk+Growth+Payout ratio 1 Company 2 Astra 3 Glaxo Wellcome pic 4 Merck 5 Novartis AG 6 Bristol-Myers Squibb 7 Pfizer Inc 8 Roche Holding AG 9 Novo Nordisk 10 Zeneca 11 American Home Prod. 12 Eli Lilly & Co 13 Smithkline Beecham 14 Abbott Laboratories 15 Rhone Poulenc Rorer 16 Pharmacia& Upjohn 17 Schering-Plough 18 Warner-Lambert 19 20 21 22 P E 261020 13249,75 68644 2417,042 141539 6207,851 175602 7196,803 100015 4098,975 109200 3319,149 160821 6306,706 75784 3019,283 23937 1036,234 56856 2632,222 69939 2506,774 44876 1471,344 56818 2667,512 90881 4544,05 21243 1041,324 54576 1970,253 41305 1449,298 P/E 19,7 28,4 22,8 24,4 24,4 32,9 25,5 25,1 23,1 21,6 27,9 30,5 21,3 20 20,4 27,7 28,5 1 1,22 1,14 1,2 1,02 1,01 0,81 1,1 0,83 0,92 1,07 1,32 0,89 0,93 1,05 1,19 0,83 Growth 13,70% 14,50% 17,10% 16,40% 14,80% 21,50% 16,60% 15,50% 19,40% 11,80% 2,70% 16,20% 12,30% 15,50% 15,30% 17,30% 28,80% Payout ratio 0,322 0,622 0,427 0,345 0,436 0,392 0,157 0,169 0,494 0,511 0,483 0,531 0,376 0,338 0,601 0,334 0,412 intoga Rita Sidlayout Formler Data Granska Visa Bertta X 19 Calibri (Brdtext) == Procent 11 AA AA NITI Katra in FK V % a 2 Vilkorstyrd Formatera Cell formatering som tabel F2 ox. fx 13,7% E G 1 1 K 1 M N P/S Risk.Growth+Payout ratio Net margin 1 Company 2 Astra 2 Glaxo Wellcome pic Merck 5 Novartis AG 5 Bristol-Myers Squibb 7 Pfizer Inc & Roche Holding AG 9 Novo Nordisk 10 Zeneca 11 American Home Prod. 12 Bil Lilly & Co 13 Smithkline Beecham 14 Abbott Laboratories 15 Rhone Poulenc Rorer 16 Pharmacia Upjohn 17 Schering-Plough 18 Warner-Lambert 19 20 21 22 23 24 25 26 27 28 29 P 261020 65644 141539 175602 100015 109200 160821 75784 23937 56856 69939 44876 56818 90881 21243 54576 41305 s 59767 9607 31777 36261 21492 17835 28807 20950 6813 14565 10939 9827 13745 85840 7589 9227 12006 D P/S 4,4 7.1 4,5 4,8 4,7 6,1 5,6 3,6 3,5 3,9 6,4 4,6 4,1 1.1 2,8 5.9 3,4 Rick 1 1.22 1,14 1,2 1.02 1,01 0.81 1.1 0.83 0,92 1,07 1,32 0,89 0,93 1,05 1,19 0.83 Growth 13.70N 14,50N 17,10% 16,40% 14,80% 21,50N 16,60% 15,50% 19,40N 11,8ON 2.70% 16,20% 12,30% 15,50N 15,30% 17,30N 28.BON Payout ratio Netmag 0,322 22.17 0,622 25,16% 0,427 19,54% 0.345 19.85% 0,436 19.07 0,192 18.61N 0,157 21,89% 0.169 14,41% 0,494 15,21% 0,511 18,07% 0,483 22,92% 0,531 14,97% 0,376 19,41 0,338 5.29% 0,601 13,72% 0,334 21,35% 0,412 12.07 30 31 32 33 34 PE PS PBV Beta CapStr Ownership Dividend Medel: 15,85% Antal: 17 Start Start Infoga Rita Sidlayout Data Formler Granska Visa Bertta x 11 Calibri (Brdtext) ' ' == y Procent L Klistra in FK U OA lili ill it . % 78-8 Vikostyrd Formatera Celle formatering som tabell F2 Xfx 13,7% C D E G H . M + N PBV Risk+Growth+Payout ratio+ROE 1 Company 2 Astra 3 Glaxo Wellcome plc 4 Merck 5 Novartis AG 6 Bristol-Myers Squibb 7 Pfizer Inc 8 Roche Holding AG Novo Nordisk 10 Zeneca 11 American Home Prod. 12 El Co 13 Smithkine Seecha 14 Abbott Laboratories 15 Rhone Poulenc Rorer 16 Pharmacias Upjohn 17 Schering-Plough 18 Warner-Lambert 19 20 23 P 261020 68644 141539 175602 100015 109200 160821 75784 23937 56856 69939 44876 56818 90881 21243 54576 41305 BV 38279 1225 11970,5 27677 6570 6954 20780 15982 2034 69621 6100.1 2276 48202 2649.4 6241 2059,9 166300 P/ 6,8 56.0 11.4 6,3 152 15,7 7.7 4.7 118 0.2 11,5 19,7 118 34,3 3.4 26,5 0.2 1 1.22 1.14 12 1.02 1,01 0.61 11 0.83 0.92 1.02 132 0,89 0.93 1.03 1.19 08 Growth 13.70 14 50% 17,10N 16.40% 14 BOX 21. 50 16. GON 15,50% 19.40% 11.BON 2.TON 16,20% 12.30% 15.50% 15,30% 17,30% 26.BOX Payout ratio 0.322 0.622 0,427 0.345 0.436 0,392 0.157 0.169 0.494 0.511 0.483 0,531 0.376 0.338 0.601 0334 0,412 ROE 23 BON 74.90% 11.00 20,90% 36.00% 30,00% 11.BON 12.40% 30,50N 26,00 28.00 35,20% 31 OON 11.40 15.00 42.00 35.00% 23 26 25 26 27 28 29 30 11 32 33 30 PS PBV + PE Beta Dividend Capst Ownership Relative Valuation.pdf Sida 1 av 2 sor . QQ Relative Valuation. Introductions In this assignment, we are using price ratios to estimate a company's stock price. More directly, we perform these estimations to estimate whether a stock is under-or overvalued. In the file Assignment 1_xls you will find the data on which you are supposed to perform your study on. The data comes from Goldman Sachs and are their valuation of 17 pharmaceutical companies made in 1996. In this assignment, you are given the Forward price ratios, which is that the E and S are future estimates of Earnings and Sales, respectively. While the BV is the present book value. When using price ratios to estimate the stock price, the valuer does not just look at one single price ratio, instead the valuer looks at several ratios. In this assignment, you are supposed to look at three: the P/E ratio, P/S ratio and the P/BV ratio. All price ratios are development of these three. 1 You should perform the study in five steps: 1. Estimate the coefficients for each independent variable for respective price ratios 2. Use the coefficients received in the previous step to estimate the theoretical price ratio for each company and ratio. 3. Compare the theoretical price ratios with the actual price ratios given in the assignment 4. If the theoretical ratio is higher than the actual ratio, then the stock is undervalued. The other way around, and the stock is overvalued. 5. Compile the outcome for each stock for each ratio whether it is under-or overvalued. A stock which is undervalued for all three ratios is most likely to be undervalued, while a changing result of under and overvalued between the ratios gets a more difficult to interpret result. Tui G Relative Valuation.pdf Sida 1 av 2 Q 1. Estimating the Coefficents of Each Independent Variable Q sok The three price ratios are based on the following formula, respectively: P/E=Risk+Growth+Payout ratio P/S=Risk+Growth+Payout ratio+Net margin P/BV=Risk+Growth+Payout ratio+ROE The file "Assignment 1_xls" you will find the data for the estimating the theoretical P/E ratio under the tab PE.(P/S under PS and P/BV under PBV). Your first estimate the coefficients of the three independent variable that effect the P/E ratio. Estimating the coefficient for each independent variable in the P/E ratio you should do the following: 1. Select horizontally 4 cells Arkly Redigera Innehill O Verktyo Fenster Relative Valuation.pdf Halp Q 2. Keeping them selected type in the first cell =LINEST(D2:018;62:618) a. 02:018 is the column with P/E ratios b. E2:618 are the columns with Risk, Growth and Payout ratio respectively 3. Press "Ctrl" + "Shift" + "Enter" tol receive the value for respective independent variables' coefficient. Observe that the coefficients are going to be in the reverse order!!!!! The result, you will receive looks like this: NOTICE THESE FIGURES ARE JUST MADE UP 22,34 9,20 7,04 0,34 Reversing the data we get from the regression that looks like this: P/E = 7.04+9.2 Risk + 22.34 Growth +0.34 Payout ratio 2. Use the coefficients received in the previous step to estimate the theoretical price ratio for each company When you have received the coefficients for each variable, you apply this value on each company to estimate the company's theoretical price ratio. For example Astra has the following value of the three variables: Risk Growth Payout ratio 1,00 13,70% 32,20% You can now estimate the theoretical P/E ratio for Astra by multiplying Astra's values for each variables with the coefficient of that variable: 2. Use the coefficients received in the previous step to estimate the theoretical price ratio for each company When you have received the coefficients for each variable, you apply this value on each company to estimate the company's theoretical price ratio, For example Astra has the following value of the three variables: Risk Growth Payout ratio 1,00 13,70% 32,20% You can now estimate the theoretical P/E ratio for Astra by multiplying Astra's values for each variables with the coefficient of that variable: P/E = 7.04 +9.2*1.0 + 22.34*13,70 +0.34*32,20 = 19.41 3. Compare the theoretical price ratios with the actual price ratios given in the assignment In the last step, you compare the estimated theoretical price ratio of each company, with that company's actual price ratio. If the theoretical price ratio is higher than the actual price ratio than we can assume that the stock is undervalued. Further, a stock which is undervalued for all three ratios is most likely to be undervalued, while a changing result of under-and overvalued between the ratios gets a more difficult to interpret result. In the above example (MADE UP FIGURES) Astra would have been overvalued since Astra's theoretical P/E ratio 19.41, which is below the actual P/E ratio of 19.71 (actually given the assignment) DIT (Divutext) Klistra in v F KU 11 ' ' av v y Procent v DU B su F2 MI x IHI fx 13,7% K% ) 38 52 B D E P/E H 1 19,7 PE=Risk+Growth+Payout ratio tr 1 Company 2 Astra str 3 Glaxo Wellcome plc 4 Merck DE 5 Novartis AG 6 Bristol-Myers Squibb n 7 Pfizer Inc 8 Roche Holding AG 9 Novo Nordisk 10 Zeneca 11 American Home Prod. 12 Eli Lilly & Co 13 Smithkline Beecham 14 Abbott Laboratories JCI 15 Rhone-Poulenc Rorer 16 Pharmacia& Upjohn ati 17 Schering-Plough na 18 Warner-Lambert 19 na 20 21 ers 22 civ 23 24 P 261020 68644 141539 175602 100015 109200 160821 75784 23937 56856 69939 44876 56818 90881 21243 54576 41305 E 13249,75 2417,042 6207,851 7196,803 4098,975 3319,149 6306,706 3019,283 1036,234 2632,222 2506,774 1471,344 2667,512 4544,05 1041,324 1970,253 1449,298 28,4 22,8 24,4 24,4 32,9 25,5 25,1 23,1 21,6 27,9 30,5 1,3 20 20,4 27,7 28,5 Risk 1 1,22 1,14 1,2 1,02 1,01 0,81 1,1 0,83 0,92 1,07 1,32 0,89 0,93 1,05 1,19 Growth 13,70% 14,50% 17,10% 16,40% 14,80% 21,50% 16,60% 15,50% 19,40% 11,80% 2,70% 16,20% 12,30% 15,50% 15,30% 17,30% 28,80% G Payout ratio 0,322 0,622 0,427 0,345 0,436 0,392 0,157 0,169 0,494 0,511 0,483 0,531 0,376 0,338 0,601 0,334 0,412 A 0,83 na 25 26 nr 27 28 A 29 30 osa Start 2 Spara automatiskt Infoga Rita Sidlayout X Calibri (Brdtext) 2. Formier athena.islearning.com Assignment 1-4 Data Granska Visa Bertta 11 A A in FK Hill Procent A AN F2 x fx 13,7% % 2.4 Forma Cum format some Sebut- C D 1 1 0 P/SRisk Growth Payout ratio.Netmargin P 261020 68644 141539 175602 100015 109200 160821 75784 23937 1 1 Company 2 Autra Glamo Wellcome plc 4 Merck 5 Novartis AS 6 Bristol-Myers Squibb 7 Princ Roche Holding AG 9 Novo Nordisk 10 Zeneca 11 American Home Prod. 12th Lilly & Co 13 Smithkline Recham 14 Abbott Laboratories 15 Rhone-Poulenc Rorer 16 Pharmacia Upjohn 17 Schering-Plough 18 Warner-Lambert 19 20 21 22 23 24 25 26 27 20 5 59767 9607 31777 36261 21492 17835 28807 20950 6813 14565 10939 9827 13745 85840 7589 9227 12006 P/S 4,4 7,1 4,5 4,8 4,7 6,1 5,6 1,6 1,5 3,9 6,4 4,6 4,1 1,3 2.8 5.9 3.4 Risk 1 1.22 1.14 1,2 1.02 1,01 0.8: 1,1 0,83 0,92 1,07 1,32 0.89 0.93 1.05 1,19 0.83 Growth 11.10 14. SON 17.10N 16.40 14.80% 21.SON 16.00 15,50 19,40% 11,80 2.70 16.205 12.10 15,50x 13,30 17,30% -20.00 H Payout ratio New 0.122 22.12 0.622 25.16 9,427 19,54 0,345 19,85N 0,436 19.07% 0.392 16,61 0,157 21.89 0.169 14.4IN 0,094 15.215 0.511 18,0 0,483 22.92 0,531 1497 0.376 19.41 0.33 5.29 0.601 13. 0,334 21,35 0,412 12.07 568SG 69939 44876 56818 90881 21243 54576 41305 30 31 23 POV PE Dividend Ownership Cap Str Beta Sum 269,40 Medoc 15.85 10 - Arkiv Redigera Visa Infoga Format Verktyg Data Fnster HO Spara automatiskt 9 athenaslearning.com Assignment 1-4 Start Infoga Rita Sidlayout Formler Data Granska Visa Bertta Calibrl (Brdtext) 11 - A A 2 Klistra in Procent FK U OA EM 02 % Very Free F2 Xfx 13,7% 06 A E . P P/BV Risk.Growth Payout ROE 261020 68544 141539 175602 100015 109200 160821 75784 23937 56856 6993 44876 56818 90881 21243 54576 41305 c BV 38279 1225 11970,5 27677 6570 6954 20780 15982 2034 6962,1 6100,1 2276 4820,2 2549,8 6241 2059,9 166309 D P/BV 6,8 56,0 11,3 63 15.2 15,7 7.7 4,7 113 1 Company 2 Astra 3 Glaxo Wellcome plc 4 Merck 5 Novartis AG 6 Bristol-Myers Squibb 7 Pfisering 8 Roche Holding AG 9 Novo Nordisk 10 Zeneca 11 American Home Prod. 12 El Lilly & Co 13 Smithkine Beecham 14 Abbott Laboratories 15 Rhone-Poulenc Rorer 16 Pharmacist Upjohn 17 Schering-Plough 18 Warner-Lambert 19 20 21 22 23 1 1.22 1,14 1,2 1.02 1.01 0,81 1.1 03) 0.92 1.07 1.02 O.RO 0.93 105 1.19 083 Growth 13 70% 14.50X 17.10% 16.40 14,80 21.50 16.6OX 15,50% 19,40% 11.00 2,70% 16,20 12,50 15.SON 15, 17.JON 28. SON Partie 0.322 0,672 0.422 0345 0.416 0,192 0,157 0.163 0,494 0.581 RDE 23.10 74.90 31.00 20,90 36.00 30,00 11. BDN 12.40% 30 SON 26.00 28.00% 350N 31 OON 11.40 IS DON ON 3.OON 0.43 11,5 19,7 11,8 34,3 3,4 26,5 0.2 0.531 0,376 0.30 0.601 0,114 0412 25 26 28 29 30 31 32 + PB PS PE You should perform the stay in five step Estimate the coefficients for each independent for respective price 2. the conficients received in the previous post ratio for each company andro mpare the theoretical price rates with the actual price rates gan in the 2 av 2 he theoretical vatios higher than the actual rutia, then the stock underhet S. Compile the outcome for each stock for each rate whether is under-areena A stock which is undervalued for all the ratio soy to be understand while a changing resultet under and overvalued between the respeto stficult to interprete 1. Estimating the Coefficents of each Independent Variable The three price ratios are based on the following for respectively p/BiGrowth Payout ratio WysokGrowthout the margin P/BvRisk Growth Payout ratione The legent 1x you will find the data for the estimating the heart under the tab / under and under POV Your first estimate the confidents of the three independent variable that affect the /rati Estimating the coefficient for each independent variable in the Prato you should do the Select horontally 2. Keeping the selected top in the first cell UNES 02.01.2018 Dos e column with tation E2618 we the comes with Growth and Payout ratio respecte 1. Pre Cor" "Shinter to receie the value for respective independent variables coefficient. Coser that the coefficients are going to be in the order The result, you will receive books NOTICE THESE GURES ARESTADE 22,34 9.20 Reversing the data we from the regression that looks like the 2. Use the coefficients received in the previous step to estimate the theoreticale ratio for each company When you tuve received the coefficients for each variable, you the end company to estimate the company theoretical foresample owing use of the three variable Mis Growth Payout ratie 1.00 11.70% 12.20 You can now estimate the theoretical Pratio For Araby multivitas each variables with the coefficient of that are PE02.0034220-19.45 1. Compare the theoretical price ratios we the actual prioratie pre assigned in the lates, you compare the estimated theoretical price of each.com that company's actual price rate the theoretical price right there ratio than we can assume that the stock is undervalued further, a stack which undervalued for all three mais la mot to be under while changes of under and overvalued between the ratios gets a more difficult to interpret result In the sbove example MADE U FIGURES Rtra would have been die theoretical p/ ratio 29.41, which is below the actual P/Est of 29.7 cm 08:46 al Klar Assignment 1 Cap Dividend Ownership PE P 08:46 Klar Assignment 1 Caps POV Dividend Owner PC IHI 08:46 Klar Assignment 1 PS PBV Beta CapStr Dividend Ownership PE Horrom HT Wampe WENN CH 364 100 IR LO 203 3 NA 31341316 Shaha STRA L RI Spara automatiskt AV Assignment 1-4 Start Infoga Rita Sidlayout Formler Data Granska Visa Bertta 11 ' 29 Procent Calibri (Brdtext) FK U Klistra in V a. Av E K% ) F2 Xfx 13,7% B D E F G H 1 Risk P/E-Risk+Growth+Payout ratio 1 Company 2 Astra 3 Glaxo Wellcome pic 4 Merck 5 Novartis AG 6 Bristol-Myers Squibb 7 Pfizer Inc 8 Roche Holding AG 9 Novo Nordisk 10 Zeneca 11 American Home Prod. 12 Eli Lilly & Co 13 Smithkline Beecham 14 Abbott Laboratories 15 Rhone Poulenc Rorer 16 Pharmacia& Upjohn 17 Schering-Plough 18 Warner-Lambert 19 20 21 22 P E 261020 13249,75 68644 2417,042 141539 6207,851 175602 7196,803 100015 4098,975 109200 3319,149 160821 6306,706 75784 3019,283 23937 1036,234 56856 2632,222 69939 2506,774 44876 1471,344 56818 2667,512 90881 4544,05 21243 1041,324 54576 1970,253 41305 1449,298 P/E 19,7 28,4 22,8 24,4 24,4 32,9 25,5 25,1 23,1 21,6 27,9 30,5 21,3 20 20,4 27,7 28,5 1 1,22 1,14 1,2 1,02 1,01 0,81 1,1 0,83 0,92 1,07 1,32 0,89 0,93 1,05 1,19 0,83 Growth 13,70% 14,50% 17,10% 16,40% 14,80% 21,50% 16,60% 15,50% 19,40% 11,80% 2,70% 16,20% 12,30% 15,50% 15,30% 17,30% 28,80% Payout ratio 0,322 0,622 0,427 0,345 0,436 0,392 0,157 0,169 0,494 0,511 0,483 0,531 0,376 0,338 0,601 0,334 0,412 intoga Rita Sidlayout Formler Data Granska Visa Bertta X 19 Calibri (Brdtext) == Procent 11 AA AA NITI Katra in FK V % a 2 Vilkorstyrd Formatera Cell formatering som tabel F2 ox. fx 13,7% E G 1 1 K 1 M N P/S Risk.Growth+Payout ratio Net margin 1 Company 2 Astra 2 Glaxo Wellcome pic Merck 5 Novartis AG 5 Bristol-Myers Squibb 7 Pfizer Inc & Roche Holding AG 9 Novo Nordisk 10 Zeneca 11 American Home Prod. 12 Bil Lilly & Co 13 Smithkline Beecham 14 Abbott Laboratories 15 Rhone Poulenc Rorer 16 Pharmacia Upjohn 17 Schering-Plough 18 Warner-Lambert 19 20 21 22 23 24 25 26 27 28 29 P 261020 65644 141539 175602 100015 109200 160821 75784 23937 56856 69939 44876 56818 90881 21243 54576 41305 s 59767 9607 31777 36261 21492 17835 28807 20950 6813 14565 10939 9827 13745 85840 7589 9227 12006 D P/S 4,4 7.1 4,5 4,8 4,7 6,1 5,6 3,6 3,5 3,9 6,4 4,6 4,1 1.1 2,8 5.9 3,4 Rick 1 1.22 1,14 1,2 1.02 1,01 0.81 1.1 0.83 0,92 1,07 1,32 0,89 0,93 1,05 1,19 0.83 Growth 13.70N 14,50N 17,10% 16,40% 14,80% 21,50N 16,60% 15,50% 19,40N 11,8ON 2.70% 16,20% 12,30% 15,50N 15,30% 17,30N 28.BON Payout ratio Netmag 0,322 22.17 0,622 25,16% 0,427 19,54% 0.345 19.85% 0,436 19.07 0,192 18.61N 0,157 21,89% 0.169 14,41% 0,494 15,21% 0,511 18,07% 0,483 22,92% 0,531 14,97% 0,376 19,41 0,338 5.29% 0,601 13,72% 0,334 21,35% 0,412 12.07 30 31 32 33 34 PE PS PBV Beta CapStr Ownership Dividend Medel: 15,85% Antal: 17 Start Start Infoga Rita Sidlayout Data Formler Granska Visa Bertta x 11 Calibri (Brdtext) ' ' == y Procent L Klistra in FK U OA lili ill it . % 78-8 Vikostyrd Formatera Celle formatering som tabell F2 Xfx 13,7% C D E G H . M + N PBV Risk+Growth+Payout ratio+ROE 1 Company 2 Astra 3 Glaxo Wellcome plc 4 Merck 5 Novartis AG 6 Bristol-Myers Squibb 7 Pfizer Inc 8 Roche Holding AG Novo Nordisk 10 Zeneca 11 American Home Prod. 12 El Co 13 Smithkine Seecha 14 Abbott Laboratories 15 Rhone Poulenc Rorer 16 Pharmacias Upjohn 17 Schering-Plough 18 Warner-Lambert 19 20 23 P 261020 68644 141539 175602 100015 109200 160821 75784 23937 56856 69939 44876 56818 90881 21243 54576 41305 BV 38279 1225 11970,5 27677 6570 6954 20780 15982 2034 69621 6100.1 2276 48202 2649.4 6241 2059,9 166300 P/ 6,8 56.0 11.4 6,3 152 15,7 7.7 4.7 118 0.2 11,5 19,7 118 34,3 3.4 26,5 0.2 1 1.22 1.14 12 1.02 1,01 0.61 11 0.83 0.92 1.02 132 0,89 0.93 1.03 1.19 08 Growth 13.70 14 50% 17,10N 16.40% 14 BOX 21. 50 16. GON 15,50% 19.40% 11.BON 2.TON 16,20% 12.30% 15.50% 15,30% 17,30% 26.BOX Payout ratio 0.322 0.622 0,427 0.345 0.436 0,392 0.157 0.169 0.494 0.511 0.483 0,531 0.376 0.338 0.601 0334 0,412 ROE 23 BON 74.90% 11.00 20,90% 36.00% 30,00% 11.BON 12.40% 30,50N 26,00 28.00 35,20% 31 OON 11.40 15.00 42.00 35.00% 23 26 25 26 27 28 29 30 11 32 33 30 PS PBV + PE Beta Dividend Capst Ownership Relative Valuation.pdf Sida 1 av 2 sor . QQ Relative Valuation. Introductions In this assignment, we are using price ratios to estimate a company's stock price. More directly, we perform these estimations to estimate whether a stock is under-or overvalued. In the file Assignment 1_xls you will find the data on which you are supposed to perform your study on. The data comes from Goldman Sachs and are their valuation of 17 pharmaceutical companies made in 1996. In this assignment, you are given the Forward price ratios, which is that the E and S are future estimates of Earnings and Sales, respectively. While the BV is the present book value. When using price ratios to estimate the stock price, the valuer does not just look at one single price ratio, instead the valuer looks at several ratios. In this assignment, you are supposed to look at three: the P/E ratio, P/S ratio and the P/BV ratio. All price ratios are development of these three. 1 You should perform the study in five steps: 1. Estimate the coefficients for each independent variable for respective price ratios 2. Use the coefficients received in the previous step to estimate the theoretical price ratio for each company and ratio. 3. Compare the theoretical price ratios with the actual price ratios given in the assignment 4. If the theoretical ratio is higher than the actual ratio, then the stock is undervalued. The other way around, and the stock is overvalued. 5. Compile the outcome for each stock for each ratio whether it is under-or overvalued. A stock which is undervalued for all three ratios is most likely to be undervalued, while a changing result of under and overvalued between the ratios gets a more difficult to interpret result. Tui G Relative Valuation.pdf Sida 1 av 2 Q 1. Estimating the Coefficents of Each Independent Variable Q sok The three price ratios are based on the following formula, respectively: P/E=Risk+Growth+Payout ratio P/S=Risk+Growth+Payout ratio+Net margin P/BV=Risk+Growth+Payout ratio+ROE The file "Assignment 1_xls" you will find the data for the estimating the theoretical P/E ratio under the tab PE.(P/S under PS and P/BV under PBV). Your first estimate the coefficients of the three independent variable that effect the P/E ratio. Estimating the coefficient for each independent variable in the P/E ratio you should do the following: 1. Select horizontally 4 cells Arkly Redigera Innehill O Verktyo Fenster Relative Valuation.pdf Halp Q 2. Keeping them selected type in the first cell =LINEST(D2:018;62:618) a. 02:018 is the column with P/E ratios b. E2:618 are the columns with Risk, Growth and Payout ratio respectively 3. Press "Ctrl" + "Shift" + "Enter" tol receive the value for respective independent variables' coefficient. Observe that the coefficients are going to be in the reverse order!!!!! The result, you will receive looks like this: NOTICE THESE FIGURES ARE JUST MADE UP 22,34 9,20 7,04 0,34 Reversing the data we get from the regression that looks like this: P/E = 7.04+9.2 Risk + 22.34 Growth +0.34 Payout ratio 2. Use the coefficients received in the previous step to estimate the theoretical price ratio for each company When you have received the coefficients for each variable, you apply this value on each company to estimate the company's theoretical price ratio. For example Astra has the following value of the three variables: Risk Growth Payout ratio 1,00 13,70% 32,20% You can now estimate the theoretical P/E ratio for Astra by multiplying Astra's values for each variables with the coefficient of that variable: 2. Use the coefficients received in the previous step to estimate the theoretical price ratio for each company When you have received the coefficients for each variable, you apply this value on each company to estimate the company's theoretical price ratio, For example Astra has the following value of the three variables: Risk Growth Payout ratio 1,00 13,70% 32,20% You can now estimate the theoretical P/E ratio for Astra by multiplying Astra's values for each variables with the coefficient of that variable: P/E = 7.04 +9.2*1.0 + 22.34*13,70 +0.34*32,20 = 19.41 3. Compare the theoretical price ratios with the actual price ratios given in the assignment In the last step, you compare the estimated theoretical price ratio of each company, with that company's actual price ratio. If the theoretical price ratio is higher than the actual price ratio than we can assume that the stock is undervalued. Further, a stock which is undervalued for all three ratios is most likely to be undervalued, while a changing result of under-and overvalued between the ratios gets a more difficult to interpret result. In the above example (MADE UP FIGURES) Astra would have been overvalued since Astra's theoretical P/E ratio 19.41, which is below the actual P/E ratio of 19.71 (actually given the assignment) DIT (Divutext) Klistra in v F KU 11 ' ' av v y Procent v DU B su F2 MI x IHI fx 13,7% K% ) 38 52 B D E P/E H 1 19,7 PE=Risk+Growth+Payout ratio tr 1 Company 2 Astra str 3 Glaxo Wellcome plc 4 Merck DE 5 Novartis AG 6 Bristol-Myers Squibb n 7 Pfizer Inc 8 Roche Holding AG 9 Novo Nordisk 10 Zeneca 11 American Home Prod. 12 Eli Lilly & Co 13 Smithkline Beecham 14 Abbott Laboratories JCI 15 Rhone-Poulenc Rorer 16 Pharmacia& Upjohn ati 17 Schering-Plough na 18 Warner-Lambert 19 na 20 21 ers 22 civ 23 24 P 261020 68644 141539 175602 100015 109200 160821 75784 23937 56856 69939 44876 56818 90881 21243 54576 41305 E 13249,75 2417,042 6207,851 7196,803 4098,975 3319,149 6306,706 3019,283 1036,234 2632,222 2506,774 1471,344 2667,512 4544,05 1041,324 1970,253 1449,298 28,4 22,8 24,4 24,4 32,9 25,5 25,1 23,1 21,6 27,9 30,5 1,3 20 20,4 27,7 28,5 Risk 1 1,22 1,14 1,2 1,02 1,01 0,81 1,1 0,83 0,92 1,07 1,32 0,89 0,93 1,05 1,19 Growth 13,70% 14,50% 17,10% 16,40% 14,80% 21,50% 16,60% 15,50% 19,40% 11,80% 2,70% 16,20% 12,30% 15,50% 15,30% 17,30% 28,80% G Payout ratio 0,322 0,622 0,427 0,345 0,436 0,392 0,157 0,169 0,494 0,511 0,483 0,531 0,376 0,338 0,601 0,334 0,412 A 0,83 na 25 26 nr 27 28 A 29 30 osa Start 2 Spara automatiskt Infoga Rita Sidlayout X Calibri (Brdtext) 2. Formier athena.islearning.com Assignment 1-4 Data Granska Visa Bertta 11 A A in FK Hill Procent A AN F2 x fx 13,7% % 2.4 Forma Cum format some Sebut- C D 1 1 0 P/SRisk Growth Payout ratio.Netmargin P 261020 68644 141539 175602 100015 109200 160821 75784 23937 1 1 Company 2 Autra Glamo Wellcome plc 4 Merck 5 Novartis AS 6 Bristol-Myers Squibb 7 Princ Roche Holding AG 9 Novo Nordisk 10 Zeneca 11 American Home Prod. 12th Lilly & Co 13 Smithkline Recham 14 Abbott Laboratories 15 Rhone-Poulenc Rorer 16 Pharmacia Upjohn 17 Schering-Plough 18 Warner-Lambert 19 20 21 22 23 24 25 26 27 20 5 59767 9607 31777 36261 21492 17835 28807 20950 6813 14565 10939 9827 13745 85840 7589 9227 12006 P/S 4,4 7,1 4,5 4,8 4,7 6,1 5,6 1,6 1,5 3,9 6,4 4,6 4,1 1,3 2.8 5.9 3.4 Risk 1 1.22 1.14 1,2 1.02 1,01 0.8: 1,1 0,83 0,92 1,07 1,32 0.89 0.93 1.05 1,19 0.83 Growth 11.10 14. SON 17.10N 16.40 14.80% 21.SON 16.00 15,50 19,40% 11,80 2.70 16.205 12.10 15,50x 13,30 17,30% -20.00 H Payout ratio New 0.122 22.12 0.622 25.16 9,427 19,54 0,345 19,85N 0,436 19.07% 0.392 16,61 0,157 21.89 0.169 14.4IN 0,094 15.215 0.511 18,0 0,483 22.92 0,531 1497 0.376 19.41 0.33 5.29 0.601 13. 0,334 21,35 0,412 12.07 568SG 69939 44876 56818 90881 21243 54576 41305 30 31 23 POV PE Dividend Ownership Cap Str Beta Sum 269,40 Medoc 15.85 10 - Arkiv Redigera Visa Infoga Format Verktyg Data Fnster HO Spara automatiskt 9 athenaslearning.com Assignment 1-4 Start Infoga Rita Sidlayout Formler Data Granska Visa Bertta Calibrl (Brdtext) 11 - A A 2 Klistra in Procent FK U OA EM 02 % Very Free F2 Xfx 13,7% 06 A E . P P/BV Risk.Growth Payout ROE 261020 68544 141539 175602 100015 109200 160821 75784 23937 56856 6993 44876 56818 90881 21243 54576 41305 c BV 38279 1225 11970,5 27677 6570 6954 20780 15982 2034 6962,1 6100,1 2276 4820,2 2549,8 6241 2059,9 166309 D P/BV 6,8 56,0 11,3 63 15.2 15,7 7.7 4,7 113 1 Company 2 Astra 3 Glaxo Wellcome plc 4 Merck 5 Novartis AG 6 Bristol-Myers Squibb 7 Pfisering 8 Roche Holding AG 9 Novo Nordisk 10 Zeneca 11 American Home Prod. 12 El Lilly & Co 13 Smithkine Beecham 14 Abbott Laboratories 15 Rhone-Poulenc Rorer 16 Pharmacist Upjohn 17 Schering-Plough 18 Warner-Lambert 19 20 21 22 23 1 1.22 1,14 1,2 1.02 1.01 0,81 1.1 03) 0.92 1.07 1.02 O.RO 0.93 105 1.19 083 Growth 13 70% 14.50X 17.10% 16.40 14,80 21.50 16.6OX 15,50% 19,40% 11.00 2,70% 16,20 12,50 15.SON 15, 17.JON 28. SON Partie 0.322 0,672 0.422 0345 0.416 0,192 0,157 0.163 0,494 0.581 RDE 23.10 74.90 31.00 20,90 36.00 30,00 11. BDN 12.40% 30 SON 26.00 28.00% 350N 31 OON 11.40 IS DON ON 3.OON 0.43 11,5 19,7 11,8 34,3 3,4 26,5 0.2 0.531 0,376 0.30 0.601 0,114 0412 25 26 28 29 30 31 32 + PB PS PE
Step by Step Solution
There are 3 Steps involved in it

Get step-by-step solutions from verified subject matter experts