

Question: D E B F Objective: This assignment is intended to give you experience in preparing a Master Budget and will help you understand the relationship
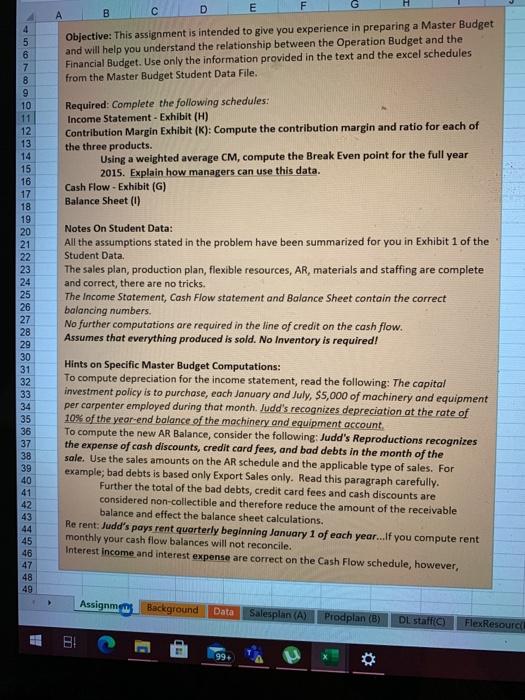
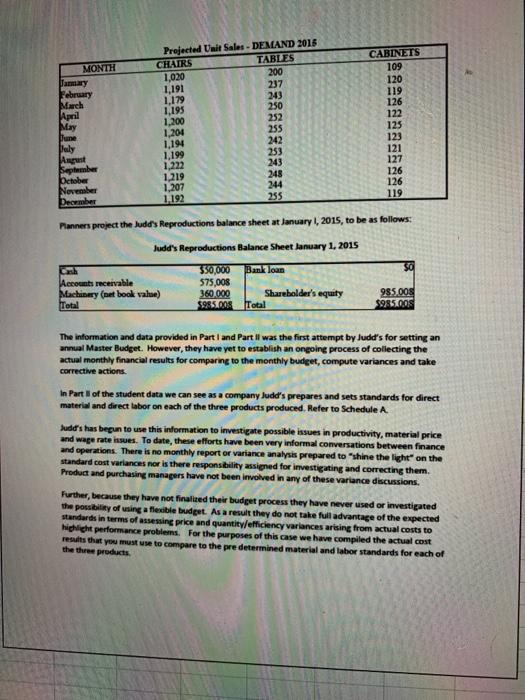
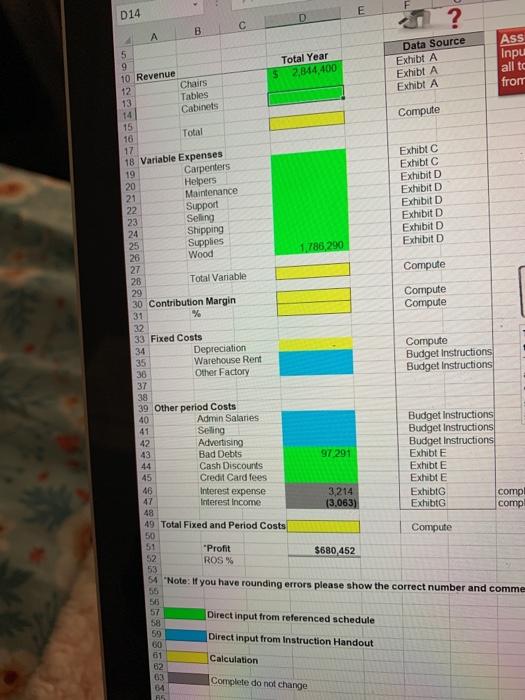
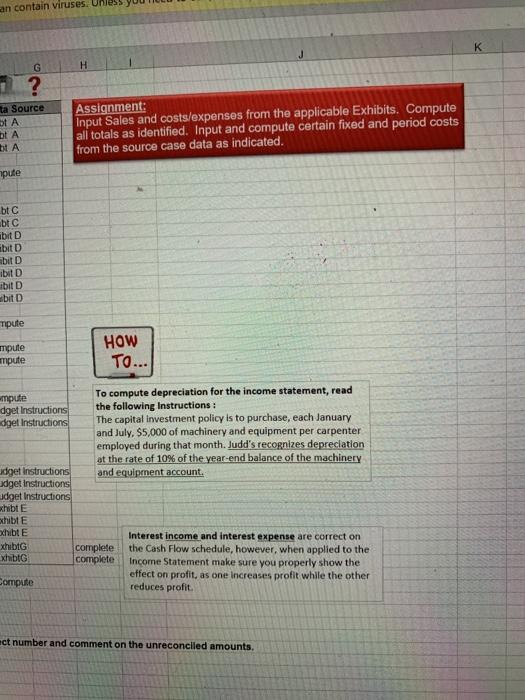
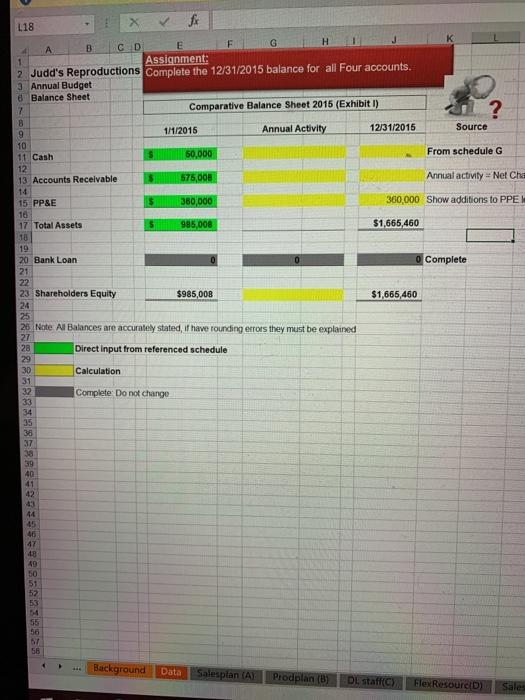
D E B F Objective: This assignment is intended to give you experience in preparing a Master Budget and will help you understand the relationship between the Operation Budget and the Financial Budget. Use only the information provided in the text and the excel schedules from the Master Budget Student Data File. Required: Complete the following schedules: Income Statement - Exhibit (H) Contribution Margin Exhibit (K): Compute the contribution margin and ratio for each of the three products. Using a weighted average CM, compute the Break Even point for the full year 2015. Explain how managers can use this data. Cash Flow - Exhibit (G) Balance Sheet (1) 4 5 6 7 8 9 10 11 12 13 14 15 16 17 18 19 20 21 22 23 24 25 26 27 28 29 30 31 32 33 34 35 36 37 38 39 40 41 42 Notes On Student Data: All the assumptions stated in the problem have been summarized for you in Exhibit 1 of the Student Data The sales plan, production plan, flexible resources, AR, materials and staffing are complete and correct, there are no tricks. The Income Statement, Cash Flow statement and Balance Sheet contain the correct balancing numbers. No further computations are required in the line of credit on the cash flow. Assumes that everything produced is sold. No Inventory is required! Hints on Specific Master Budget Computations: To compute depreciation for the income statement, read the following: The capital investment policy is to purchase, each January and July, $5,000 of machinery and equipment per carpenter employed during that month. Judd's recognizes depreciation at the rate of 10% of the yearend balance of the machinery and equipment account To compute the new AR Balance, consider the following: Judd's Reproductions recognizes the expense of cash discounts, credit card fees, and bad debts in the month of the sale. Use the sales amounts on the AR schedule and the applicable type of sales. For example, bad debts is based only Export Sales only. Read this paragraph carefully. Further the total of the bad debts, credit card fees and cash discounts are considered non-collectible and therefore reduce the amount of the receivable balance and effect the balance sheet calculations. Re rent: Judd's pays rent quarterly beginning January 1 of each year...If you compute rent monthly your cash flow balances will not reconcile. Interest income and interest expense are correct on the Cash Flow schedule, however, 44 45 46 47 48 49 Assignments Background Data Salesplan (A) Prodplan (B) DL staff) FlexResource B! 99+ MONTH January February March April May Dune Moly August September October November Dember Projected Unit Sales - DEMAND 2016 CHAIRS TABLES 1,020 200 1,191 237 1,179 243 1,195 250 1,200 252 1,204 255 1.194 242 1,199 253 1,222 243 1.219 248 1.207 244 1 192 255 CABINETS 109 120 119 126 122 125 123 121 127 126 126 119 Planners project the Judd's Reproductions balance sheet at January 1, 2015, to be as follows: Judd's Reproductions Balance Sheet January 1, 2015 Bank loan 50 GB Accounts receivable Machinery (net book value) Total 350,000 575,008 360.000 5985.00 Shareholder's equity Total 985.00 $985.00 The information and data provided in Part 1 and Part I was the first attempt by Judd's for setting an annual Master Budget. However, they have yet to establish an ongoing process of collecting the actual monthly Financial results for comparing to the monthly budget, compute variances and take corrective actions. In Part of the student data we can see as a company ludd's prepares and sets standards for direct material and direct labor on each of the three products produced. Refer to Schedule A Judd's has begun to use this information to investigate possible issues in productivity, material price and wage rate issues. To date, these efforts have been very informal conversations between finance and operations. There is no monthly report or variance analysis prepared to "shine the light on the standard cost variances nor is there responsibility assigned for investigating and correcting them. Product and purchasing managers have not been involved in any of these variance discussions. Further, because they have not finalized their budget process they have never used or investigated the possibility of using a flexible budget. As a result they do not take advantage of the expected standards in terms of assessing price and quantity/efficiency variances arising from actual costs to Highlight performance problems. For the purposes of this case we have compiled the actual cost results that you must use to compare to the pre determined material and labor standards for each of the three products E D14 D ? B A Total Year 2,844.400 Data Source Exhibt A Exhibt A Exhibt A Ass Inpu all te from Compute Exhibtc Exhibtc Exhibit D Exhibit D Exhibit D Exhibit D Exhibit D Exhibit D 1.786 290 Compute 5 9 10 Revenue 12 Chairs 13 Tables 14 Cabinets 15 16 Total 17 18 Variable Expenses 19 Carpenters 20 Helpers 21 Maintenance 22 Support 23 Seling 24 Shipping 25 Supplies 26 Wood 27 28 Total Variable 29 30 Contribution Margin 31 % 32 33 Fixed Costs 34 Depreciation 35 Warehouse Rent 36 Other Factory 37 38 39 Other period Costs 40 Admin Salaries 41 Seling 42 Advertising 43 Bad Debts 44 Cash Discounts 45 Credit Card fees 46 47 48 Compute Compute Compute Budget Instructions Budget Instructions 97 291 Budget Instructions Budget Instructions Budget Instructions Exhibt Exhibt E Exhibt E Exhibt comp Exhibt comp Interest expense Interest income 3,214 (3,063) 49 Total Fixed and Period Costs Compute 50 51 "Profit $680 452 52 ROS% 53 54 "Note: If you have rounding errors please show the correct number and comme 56 57 Direct input from referenced schedule 58 59 Direct input from Instruction Handout 60 61 Calculation 62 63 Complete do not change 04 an contain viruses. K G H 1 ? ta Source et A ot A ht A Assignment: Input Sales and costs/expenses from the applicable Exhibits. Compute all totals as identified. Input and compute certain fixed and period costs from the source case data as indicated. pute bt C bt C abit D bit abit D ibit D ibit D abit D Tpute mpute mpute HOW TO... mpute To compute depreciation for the income statement, read dget Instructions the following Instructions: dget Instructions The capital investment policy is to purchase, each January and July $5,000 of machinery and equipment per carpenter employed during that month. Judd's recognizes depreciation at the rate of 10% of the year-end balance of the machinery Udget Instructions and equipment account. dget instructions udget Instructions hib E xhibt E exhibt E Interest income and interest expense are correct on xhibt complete the Cash Flow schedule, however, when applied to the xhibt complete Income Statement make sure you properly show the effect on profit, as one increases profit while the other Compute reduces profit. act number and comment on the unreconciled amounts. R ? L18 C D A B F E H G 1 Assignment: 2 Judd's Reproductions Complete the 12/31/2015 balance for all Four accounts. 3 Annual Budget 8 Balance Sheet 7 Comparative Balance Sheet 2015 (Exhibit 1) 8 9 11/2015 Annual Activity 12/31/2015 Source 10 11 Cash 50,000 From schedule G 12 13 Accounts Receivable $ 575,008 Annual activity Net Che 14 15 PPSE $ 360,000 360,000 Show additions to PPE 16 17 Total Assets 995,008 $1,665,460 18 19 20 Bank Loan Complete 21 22 23 Shareholders Equity $985,008 $1,665,460 24 25 26 Note All Balances are accurately stated, if have founding errors they must be explained 27 28 Direct input from referenced schedule Calculation 30 31 32 33 Complete Do not change 39 39 40 41 42 43 47 48 49 50 51 52 53 54 55 57 58 Background Data Salesplan (A) Prodplan (B) DL staffic) FlexResourc) Sales D E B F Objective: This assignment is intended to give you experience in preparing a Master Budget and will help you understand the relationship between the Operation Budget and the Financial Budget. Use only the information provided in the text and the excel schedules from the Master Budget Student Data File. Required: Complete the following schedules: Income Statement - Exhibit (H) Contribution Margin Exhibit (K): Compute the contribution margin and ratio for each of the three products. Using a weighted average CM, compute the Break Even point for the full year 2015. Explain how managers can use this data. Cash Flow - Exhibit (G) Balance Sheet (1) 4 5 6 7 8 9 10 11 12 13 14 15 16 17 18 19 20 21 22 23 24 25 26 27 28 29 30 31 32 33 34 35 36 37 38 39 40 41 42 Notes On Student Data: All the assumptions stated in the problem have been summarized for you in Exhibit 1 of the Student Data The sales plan, production plan, flexible resources, AR, materials and staffing are complete and correct, there are no tricks. The Income Statement, Cash Flow statement and Balance Sheet contain the correct balancing numbers. No further computations are required in the line of credit on the cash flow. Assumes that everything produced is sold. No Inventory is required! Hints on Specific Master Budget Computations: To compute depreciation for the income statement, read the following: The capital investment policy is to purchase, each January and July, $5,000 of machinery and equipment per carpenter employed during that month. Judd's recognizes depreciation at the rate of 10% of the yearend balance of the machinery and equipment account To compute the new AR Balance, consider the following: Judd's Reproductions recognizes the expense of cash discounts, credit card fees, and bad debts in the month of the sale. Use the sales amounts on the AR schedule and the applicable type of sales. For example, bad debts is based only Export Sales only. Read this paragraph carefully. Further the total of the bad debts, credit card fees and cash discounts are considered non-collectible and therefore reduce the amount of the receivable balance and effect the balance sheet calculations. Re rent: Judd's pays rent quarterly beginning January 1 of each year...If you compute rent monthly your cash flow balances will not reconcile. Interest income and interest expense are correct on the Cash Flow schedule, however, 44 45 46 47 48 49 Assignments Background Data Salesplan (A) Prodplan (B) DL staff) FlexResource B! 99+ MONTH January February March April May Dune Moly August September October November Dember Projected Unit Sales - DEMAND 2016 CHAIRS TABLES 1,020 200 1,191 237 1,179 243 1,195 250 1,200 252 1,204 255 1.194 242 1,199 253 1,222 243 1.219 248 1.207 244 1 192 255 CABINETS 109 120 119 126 122 125 123 121 127 126 126 119 Planners project the Judd's Reproductions balance sheet at January 1, 2015, to be as follows: Judd's Reproductions Balance Sheet January 1, 2015 Bank loan 50 GB Accounts receivable Machinery (net book value) Total 350,000 575,008 360.000 5985.00 Shareholder's equity Total 985.00 $985.00 The information and data provided in Part 1 and Part I was the first attempt by Judd's for setting an annual Master Budget. However, they have yet to establish an ongoing process of collecting the actual monthly Financial results for comparing to the monthly budget, compute variances and take corrective actions. In Part of the student data we can see as a company ludd's prepares and sets standards for direct material and direct labor on each of the three products produced. Refer to Schedule A Judd's has begun to use this information to investigate possible issues in productivity, material price and wage rate issues. To date, these efforts have been very informal conversations between finance and operations. There is no monthly report or variance analysis prepared to "shine the light on the standard cost variances nor is there responsibility assigned for investigating and correcting them. Product and purchasing managers have not been involved in any of these variance discussions. Further, because they have not finalized their budget process they have never used or investigated the possibility of using a flexible budget. As a result they do not take advantage of the expected standards in terms of assessing price and quantity/efficiency variances arising from actual costs to Highlight performance problems. For the purposes of this case we have compiled the actual cost results that you must use to compare to the pre determined material and labor standards for each of the three products E D14 D ? B A Total Year 2,844.400 Data Source Exhibt A Exhibt A Exhibt A Ass Inpu all te from Compute Exhibtc Exhibtc Exhibit D Exhibit D Exhibit D Exhibit D Exhibit D Exhibit D 1.786 290 Compute 5 9 10 Revenue 12 Chairs 13 Tables 14 Cabinets 15 16 Total 17 18 Variable Expenses 19 Carpenters 20 Helpers 21 Maintenance 22 Support 23 Seling 24 Shipping 25 Supplies 26 Wood 27 28 Total Variable 29 30 Contribution Margin 31 % 32 33 Fixed Costs 34 Depreciation 35 Warehouse Rent 36 Other Factory 37 38 39 Other period Costs 40 Admin Salaries 41 Seling 42 Advertising 43 Bad Debts 44 Cash Discounts 45 Credit Card fees 46 47 48 Compute Compute Compute Budget Instructions Budget Instructions 97 291 Budget Instructions Budget Instructions Budget Instructions Exhibt Exhibt E Exhibt E Exhibt comp Exhibt comp Interest expense Interest income 3,214 (3,063) 49 Total Fixed and Period Costs Compute 50 51 "Profit $680 452 52 ROS% 53 54 "Note: If you have rounding errors please show the correct number and comme 56 57 Direct input from referenced schedule 58 59 Direct input from Instruction Handout 60 61 Calculation 62 63 Complete do not change 04 an contain viruses. K G H 1 ? ta Source et A ot A ht A Assignment: Input Sales and costs/expenses from the applicable Exhibits. Compute all totals as identified. Input and compute certain fixed and period costs from the source case data as indicated. pute bt C bt C abit D bit abit D ibit D ibit D abit D Tpute mpute mpute HOW TO... mpute To compute depreciation for the income statement, read dget Instructions the following Instructions: dget Instructions The capital investment policy is to purchase, each January and July $5,000 of machinery and equipment per carpenter employed during that month. Judd's recognizes depreciation at the rate of 10% of the year-end balance of the machinery Udget Instructions and equipment account. dget instructions udget Instructions hib E xhibt E exhibt E Interest income and interest expense are correct on xhibt complete the Cash Flow schedule, however, when applied to the xhibt complete Income Statement make sure you properly show the effect on profit, as one increases profit while the other Compute reduces profit. act number and comment on the unreconciled amounts. R ? L18 C D A B F E H G 1 Assignment: 2 Judd's Reproductions Complete the 12/31/2015 balance for all Four accounts. 3 Annual Budget 8 Balance Sheet 7 Comparative Balance Sheet 2015 (Exhibit 1) 8 9 11/2015 Annual Activity 12/31/2015 Source 10 11 Cash 50,000 From schedule G 12 13 Accounts Receivable $ 575,008 Annual activity Net Che 14 15 PPSE $ 360,000 360,000 Show additions to PPE 16 17 Total Assets 995,008 $1,665,460 18 19 20 Bank Loan Complete 21 22 23 Shareholders Equity $985,008 $1,665,460 24 25 26 Note All Balances are accurately stated, if have founding errors they must be explained 27 28 Direct input from referenced schedule Calculation 30 31 32 33 Complete Do not change 39 39 40 41 42 43 47 48 49 50 51 52 53 54 55 57 58 Background Data Salesplan (A) Prodplan (B) DL staffic) FlexResourc) Sales
Step by Step Solution
There are 3 Steps involved in it

Get step-by-step solutions from verified subject matter experts