

Question: D E F G TB C Problem 5: Portfolio Theory Expected Return Stardard deviation (sigma) 22 In the graph above 23 the green point indicates
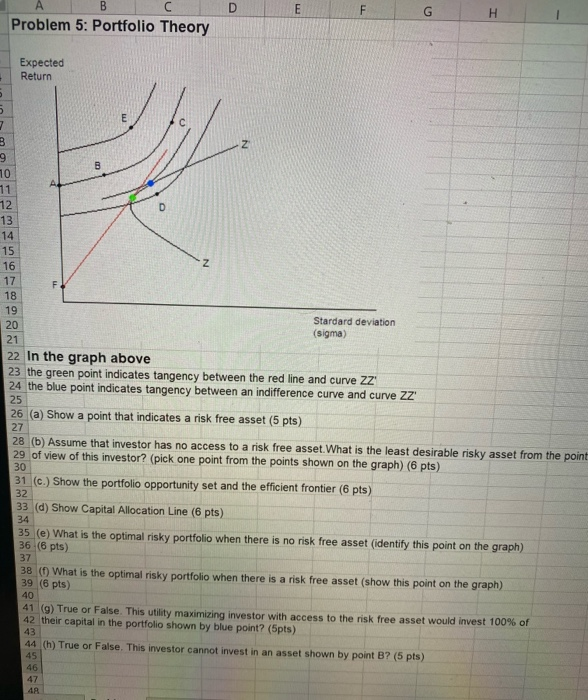
D E F G TB C Problem 5: Portfolio Theory Expected Return Stardard deviation (sigma) 22 In the graph above 23 the green point indicates tangency between the red line and curve ZZ 24 the blue point indicates tangency between an indifference curve and curve ZZ 25 26 (a) Show a point that indicates a risk free asset (5 pts) 27 28 (b) Assume that investor has no access to a risk free asset. What is the least desirable risky asset from the poin 29 of view of this investor? (pick one point from the points shown on the graph) (6 pts) 31 (c.) Show the portfolio opportunity set and the efficient frontier (6 pts) 33 (d) Show Capital Allocation Line (6 pts) 34 35 (e) What is the optimal risky portfolio when there is no risk free asset (identify this point on the graph) 36 (6 pts) 37 38 ) What is the optimal risky portfolio when there is a risk free asset (show this point on the graph) 39 (6 pts) 419) True or False. This utility maximizing investor with access to the risk free asset would invest 100% of 42 their capital in the portfolio shown by blue point? (5pts) 40 44 (h) True or False. This investor cannot invest in an asset shown by point B? (5 pts)
Step by Step Solution
There are 3 Steps involved in it

Get step-by-step solutions from verified subject matter experts