

Question: D E Multiproduct Break-Even Analysis Student Nam Instructions: (1) Complete (manually) the DATA table on the right, varying item 1 a the three items, using
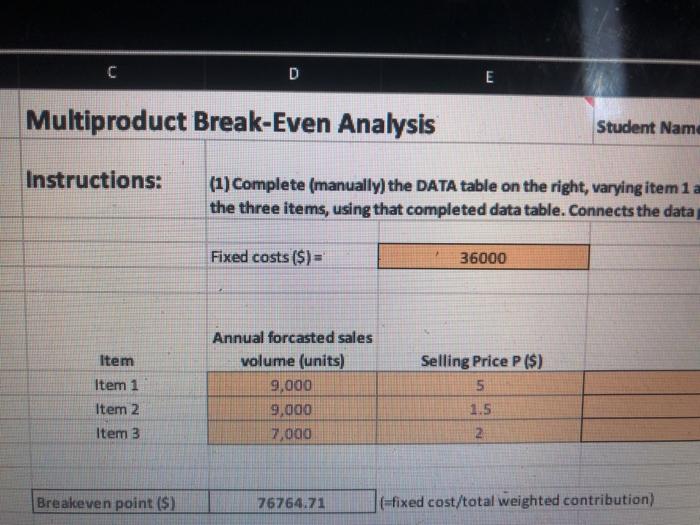
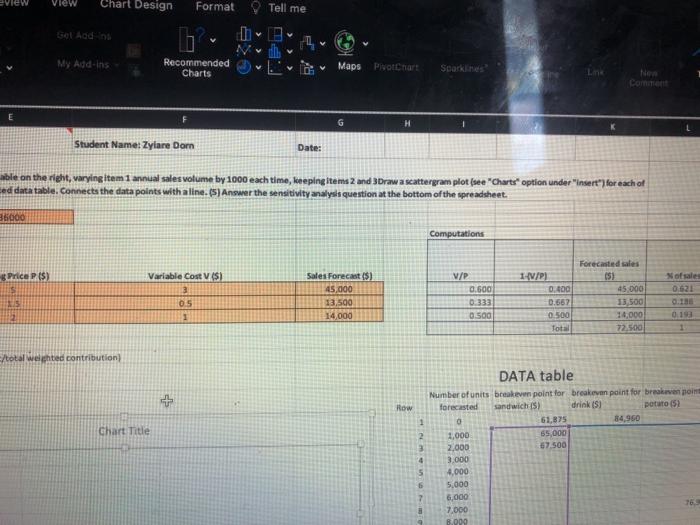
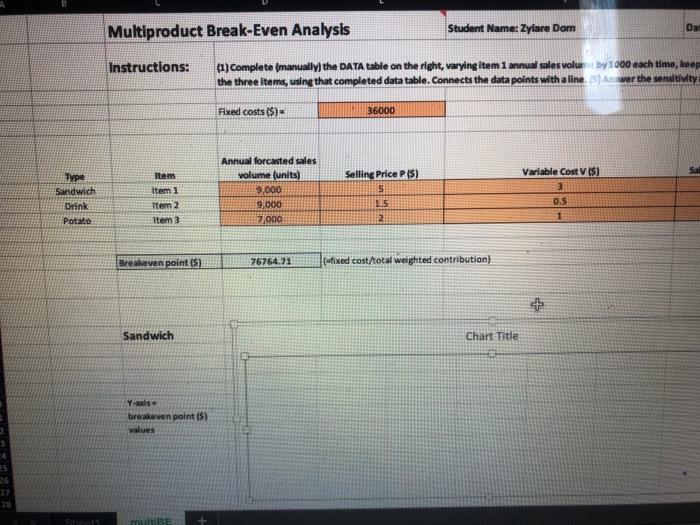
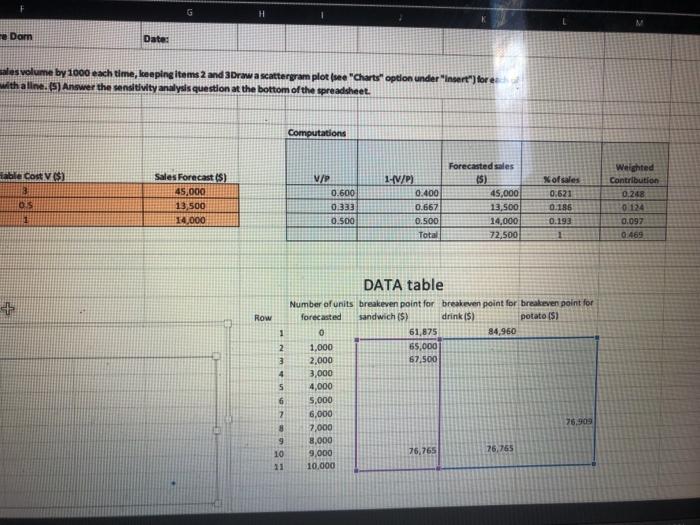
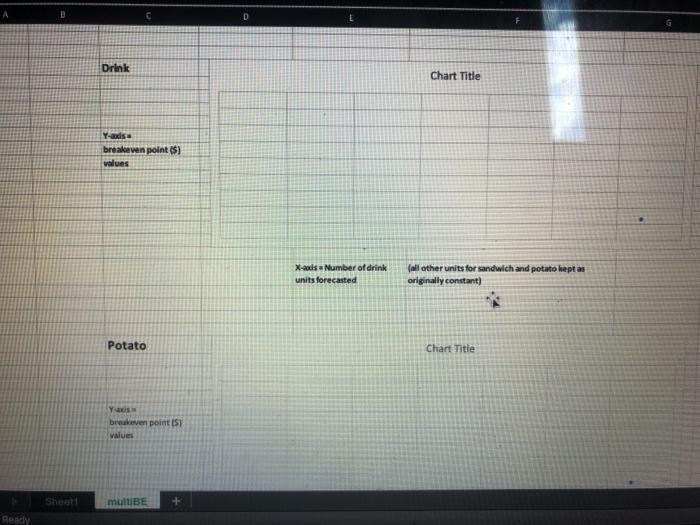
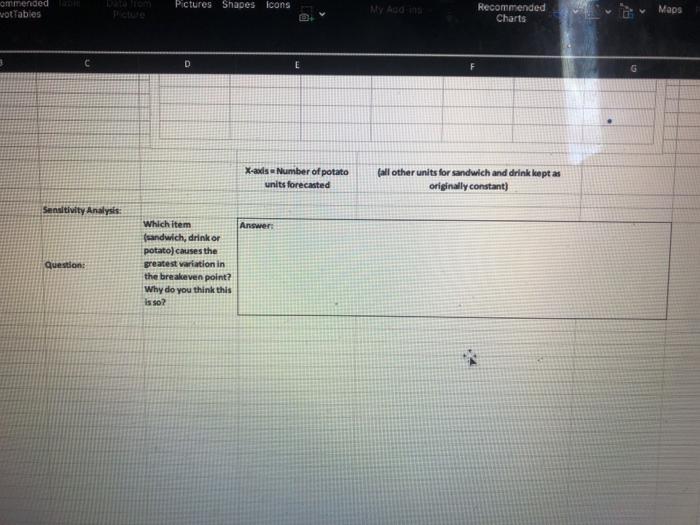
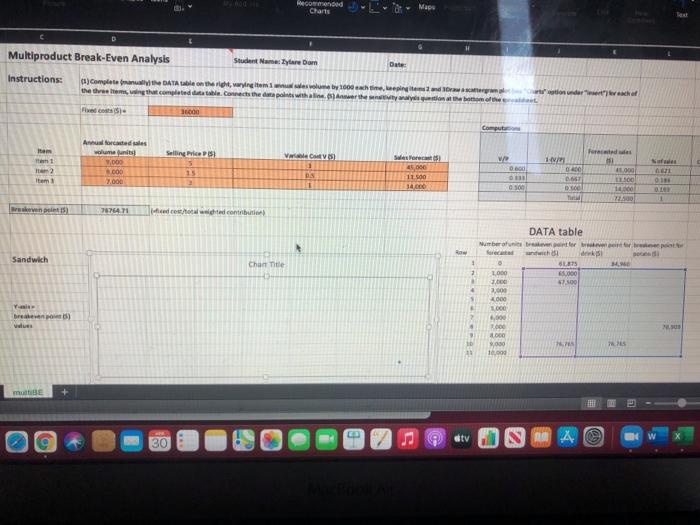
D E Multiproduct Break-Even Analysis Student Nam Instructions: (1) Complete (manually) the DATA table on the right, varying item 1 a the three items, using that completed data table. Connects the data Fixed costs ($)= 36000 Item Item 1 Annual forcasted sales volume (units) 9,000 9,000 7,000 Selling Price P ($) 5 1.5 2 Item 2 Item 3 Breakeven point ($) 76764.71 (-fixed cost/total weighted contribution) View View Chart Design Format Tell me > SO My Add-ins Vith Recommended Lid Charts Maps Pitt Chart Sparklines Link there Comment G H Student Name: Zylare Dorn Date: able on the right varying item 1 annual sales volume by 1000 each time, keeping items 2 and 3Draw a scattergram plot (see "Charts" option under "insert") for each of Eed data table, Connects the data points with a line. (5) Answer the sensitivity analysis question at the bottom of the spreadsheet. 6000 Computations Forecasted sales Price PS) Nofsale 0.621 Variable Cost (5) 3 0.5 1 Sales Forecast (5) 45,000 13,500 14 000 V/P 0.600 0.333 0.500 TS 1-VP 0.400 0.667 0.500 Total 45,000 15,500 14.000 72.500 0.19 /total weighted contribution Row Chart Title 1 2 3 4 5 DATA table Number of units breakeven point for breakeven point for breakeven poin forecasted sandwich (5) drink (5) potato (5) 0 61,875 84.960 1,000 65,000 2.000 67.500 3.000 4,000 5.000 6,000 7,000 76 B.000 7 Da Multiproduct Break-Even Analysis Student Name: Zylare Dam Instructions: (1) Complete (manually the DATA table on the right varying item 1 annual sales volumby 1000 each time, keep the three items, using that completed data table. Connects the data points with a line. 5) Antwer the sensitivity Fixed costs (5) 36000 Type Sandwich Drink Item Item 1 Item2 Item 3 Annual forcested sales volume (units) 9,000 9,000 7,000 Selling Price PIS) 5 1.5 Variable Cost (5) 3 0.5 1 Potato 2 Breakeven point (5) 76764.71 fixed cost/total weighted contribution) + Sandwich Chart Title Yods breakeven point (5) values 35 22 multiBE e Dar Date: sales volume by 1000 each time, keeping items 2 and 3Draw a scattergram plotsee "Charts" option under "insert")fore with a line. (5) Answer the sensitivity analysis question at the bottom of the spreadsheet. Computations able Cost ($) Weighted Contribution Sales Forecast (8) 45,000 13 500 14.000 OS V/P 0.600 0333 10.500 1-IV/P) 0.400 0.667 0.500 Total Forecasted sales 15) 45,000 13,500 14,000 72,500 Xof sales 0,521 0.185 0.193 0.248 0 124 0.097 1 1 0.469 Row 1 2 3 4 DATA table Number of units breakeven point for breakeven point for breakeven point for forecasted sandwich ($) drink (5) potato (5) 0 61,875 84,960 1,000 65,000 2,000 67,500 3,000 4,000 5,000 6,000 7,000 76.909 8,000 9,000 76,765 76,765 10.000 5 6 Z 8 9 10 11 E Drink Chart Title Y-ads breakeven point ($) values X-aadis Number of drink units forecasted (all other units for sandwich and potato keptas originally constant) Potato Chart Title Y as breakeven points values Sheath multiBE + Ready ommended votTables Pictures Shapes Icons My Add Recommended Charts Maps 3 C D E X-audis Number of potato units forecasted (all other units for sandwich and drink kept as originally constant) Sensitivity Analysis: Answer: questions Which item (sandwich, drink or potato) causes the greatest variation in the breakeven point? Why do you think this isso? becomended Magu Multiproduct Break-Even Analysis Student Nama Dare Dom Instructions: ) Complete the DATA ble on the waying items by 1000 chand the theaterms, wing that.com table connects the data points within the son of the we 11.00 undertech Itam Anastas woman W.000 Selling Price PBI Perted VC 1 We Deod Search 45,000 11 do 34.000 Hem 2 Item 000 . 40 . 7.000 3 0.500 40.000 100 10000 2.500 BAN ren15 7764 do contributi Sandwich DATA table Number of for bort with drinks BTS 1 000 5.000 1.00 57.100 Chant Title 2 . Vai breve) ws 4.000 LOOD 4.00 9 10 2000 9.00 10.00 mu 2 otv C 30 NA D E Multiproduct Break-Even Analysis Student Nam Instructions: (1) Complete (manually) the DATA table on the right, varying item 1 a the three items, using that completed data table. Connects the data Fixed costs ($)= 36000 Item Item 1 Annual forcasted sales volume (units) 9,000 9,000 7,000 Selling Price P ($) 5 1.5 2 Item 2 Item 3 Breakeven point ($) 76764.71 (-fixed cost/total weighted contribution) View View Chart Design Format Tell me > SO My Add-ins Vith Recommended Lid Charts Maps Pitt Chart Sparklines Link there Comment G H Student Name: Zylare Dorn Date: able on the right varying item 1 annual sales volume by 1000 each time, keeping items 2 and 3Draw a scattergram plot (see "Charts" option under "insert") for each of Eed data table, Connects the data points with a line. (5) Answer the sensitivity analysis question at the bottom of the spreadsheet. 6000 Computations Forecasted sales Price PS) Nofsale 0.621 Variable Cost (5) 3 0.5 1 Sales Forecast (5) 45,000 13,500 14 000 V/P 0.600 0.333 0.500 TS 1-VP 0.400 0.667 0.500 Total 45,000 15,500 14.000 72.500 0.19 /total weighted contribution Row Chart Title 1 2 3 4 5 DATA table Number of units breakeven point for breakeven point for breakeven poin forecasted sandwich (5) drink (5) potato (5) 0 61,875 84.960 1,000 65,000 2.000 67.500 3.000 4,000 5.000 6,000 7,000 76 B.000 7 Da Multiproduct Break-Even Analysis Student Name: Zylare Dam Instructions: (1) Complete (manually the DATA table on the right varying item 1 annual sales volumby 1000 each time, keep the three items, using that completed data table. Connects the data points with a line. 5) Antwer the sensitivity Fixed costs (5) 36000 Type Sandwich Drink Item Item 1 Item2 Item 3 Annual forcested sales volume (units) 9,000 9,000 7,000 Selling Price PIS) 5 1.5 Variable Cost (5) 3 0.5 1 Potato 2 Breakeven point (5) 76764.71 fixed cost/total weighted contribution) + Sandwich Chart Title Yods breakeven point (5) values 35 22 multiBE e Dar Date: sales volume by 1000 each time, keeping items 2 and 3Draw a scattergram plotsee "Charts" option under "insert")fore with a line. (5) Answer the sensitivity analysis question at the bottom of the spreadsheet. Computations able Cost ($) Weighted Contribution Sales Forecast (8) 45,000 13 500 14.000 OS V/P 0.600 0333 10.500 1-IV/P) 0.400 0.667 0.500 Total Forecasted sales 15) 45,000 13,500 14,000 72,500 Xof sales 0,521 0.185 0.193 0.248 0 124 0.097 1 1 0.469 Row 1 2 3 4 DATA table Number of units breakeven point for breakeven point for breakeven point for forecasted sandwich ($) drink (5) potato (5) 0 61,875 84,960 1,000 65,000 2,000 67,500 3,000 4,000 5,000 6,000 7,000 76.909 8,000 9,000 76,765 76,765 10.000 5 6 Z 8 9 10 11 E Drink Chart Title Y-ads breakeven point ($) values X-aadis Number of drink units forecasted (all other units for sandwich and potato keptas originally constant) Potato Chart Title Y as breakeven points values Sheath multiBE + Ready ommended votTables Pictures Shapes Icons My Add Recommended Charts Maps 3 C D E X-audis Number of potato units forecasted (all other units for sandwich and drink kept as originally constant) Sensitivity Analysis: Answer: questions Which item (sandwich, drink or potato) causes the greatest variation in the breakeven point? Why do you think this isso? becomended Magu Multiproduct Break-Even Analysis Student Nama Dare Dom Instructions: ) Complete the DATA ble on the waying items by 1000 chand the theaterms, wing that.com table connects the data points within the son of the we 11.00 undertech Itam Anastas woman W.000 Selling Price PBI Perted VC 1 We Deod Search 45,000 11 do 34.000 Hem 2 Item 000 . 40 . 7.000 3 0.500 40.000 100 10000 2.500 BAN ren15 7764 do contributi Sandwich DATA table Number of for bort with drinks BTS 1 000 5.000 1.00 57.100 Chant Title 2 . Vai breve) ws 4.000 LOOD 4.00 9 10 2000 9.00 10.00 mu 2 otv C 30 NA
Step by Step Solution
There are 3 Steps involved in it

Get step-by-step solutions from verified subject matter experts