

Question: d Finder File Edit View Go Window Help & ThuApr4 11:09AM @ ng.cengage.com LERT LT :W CENGAGE ' MINDTAP Q search this course Module Five
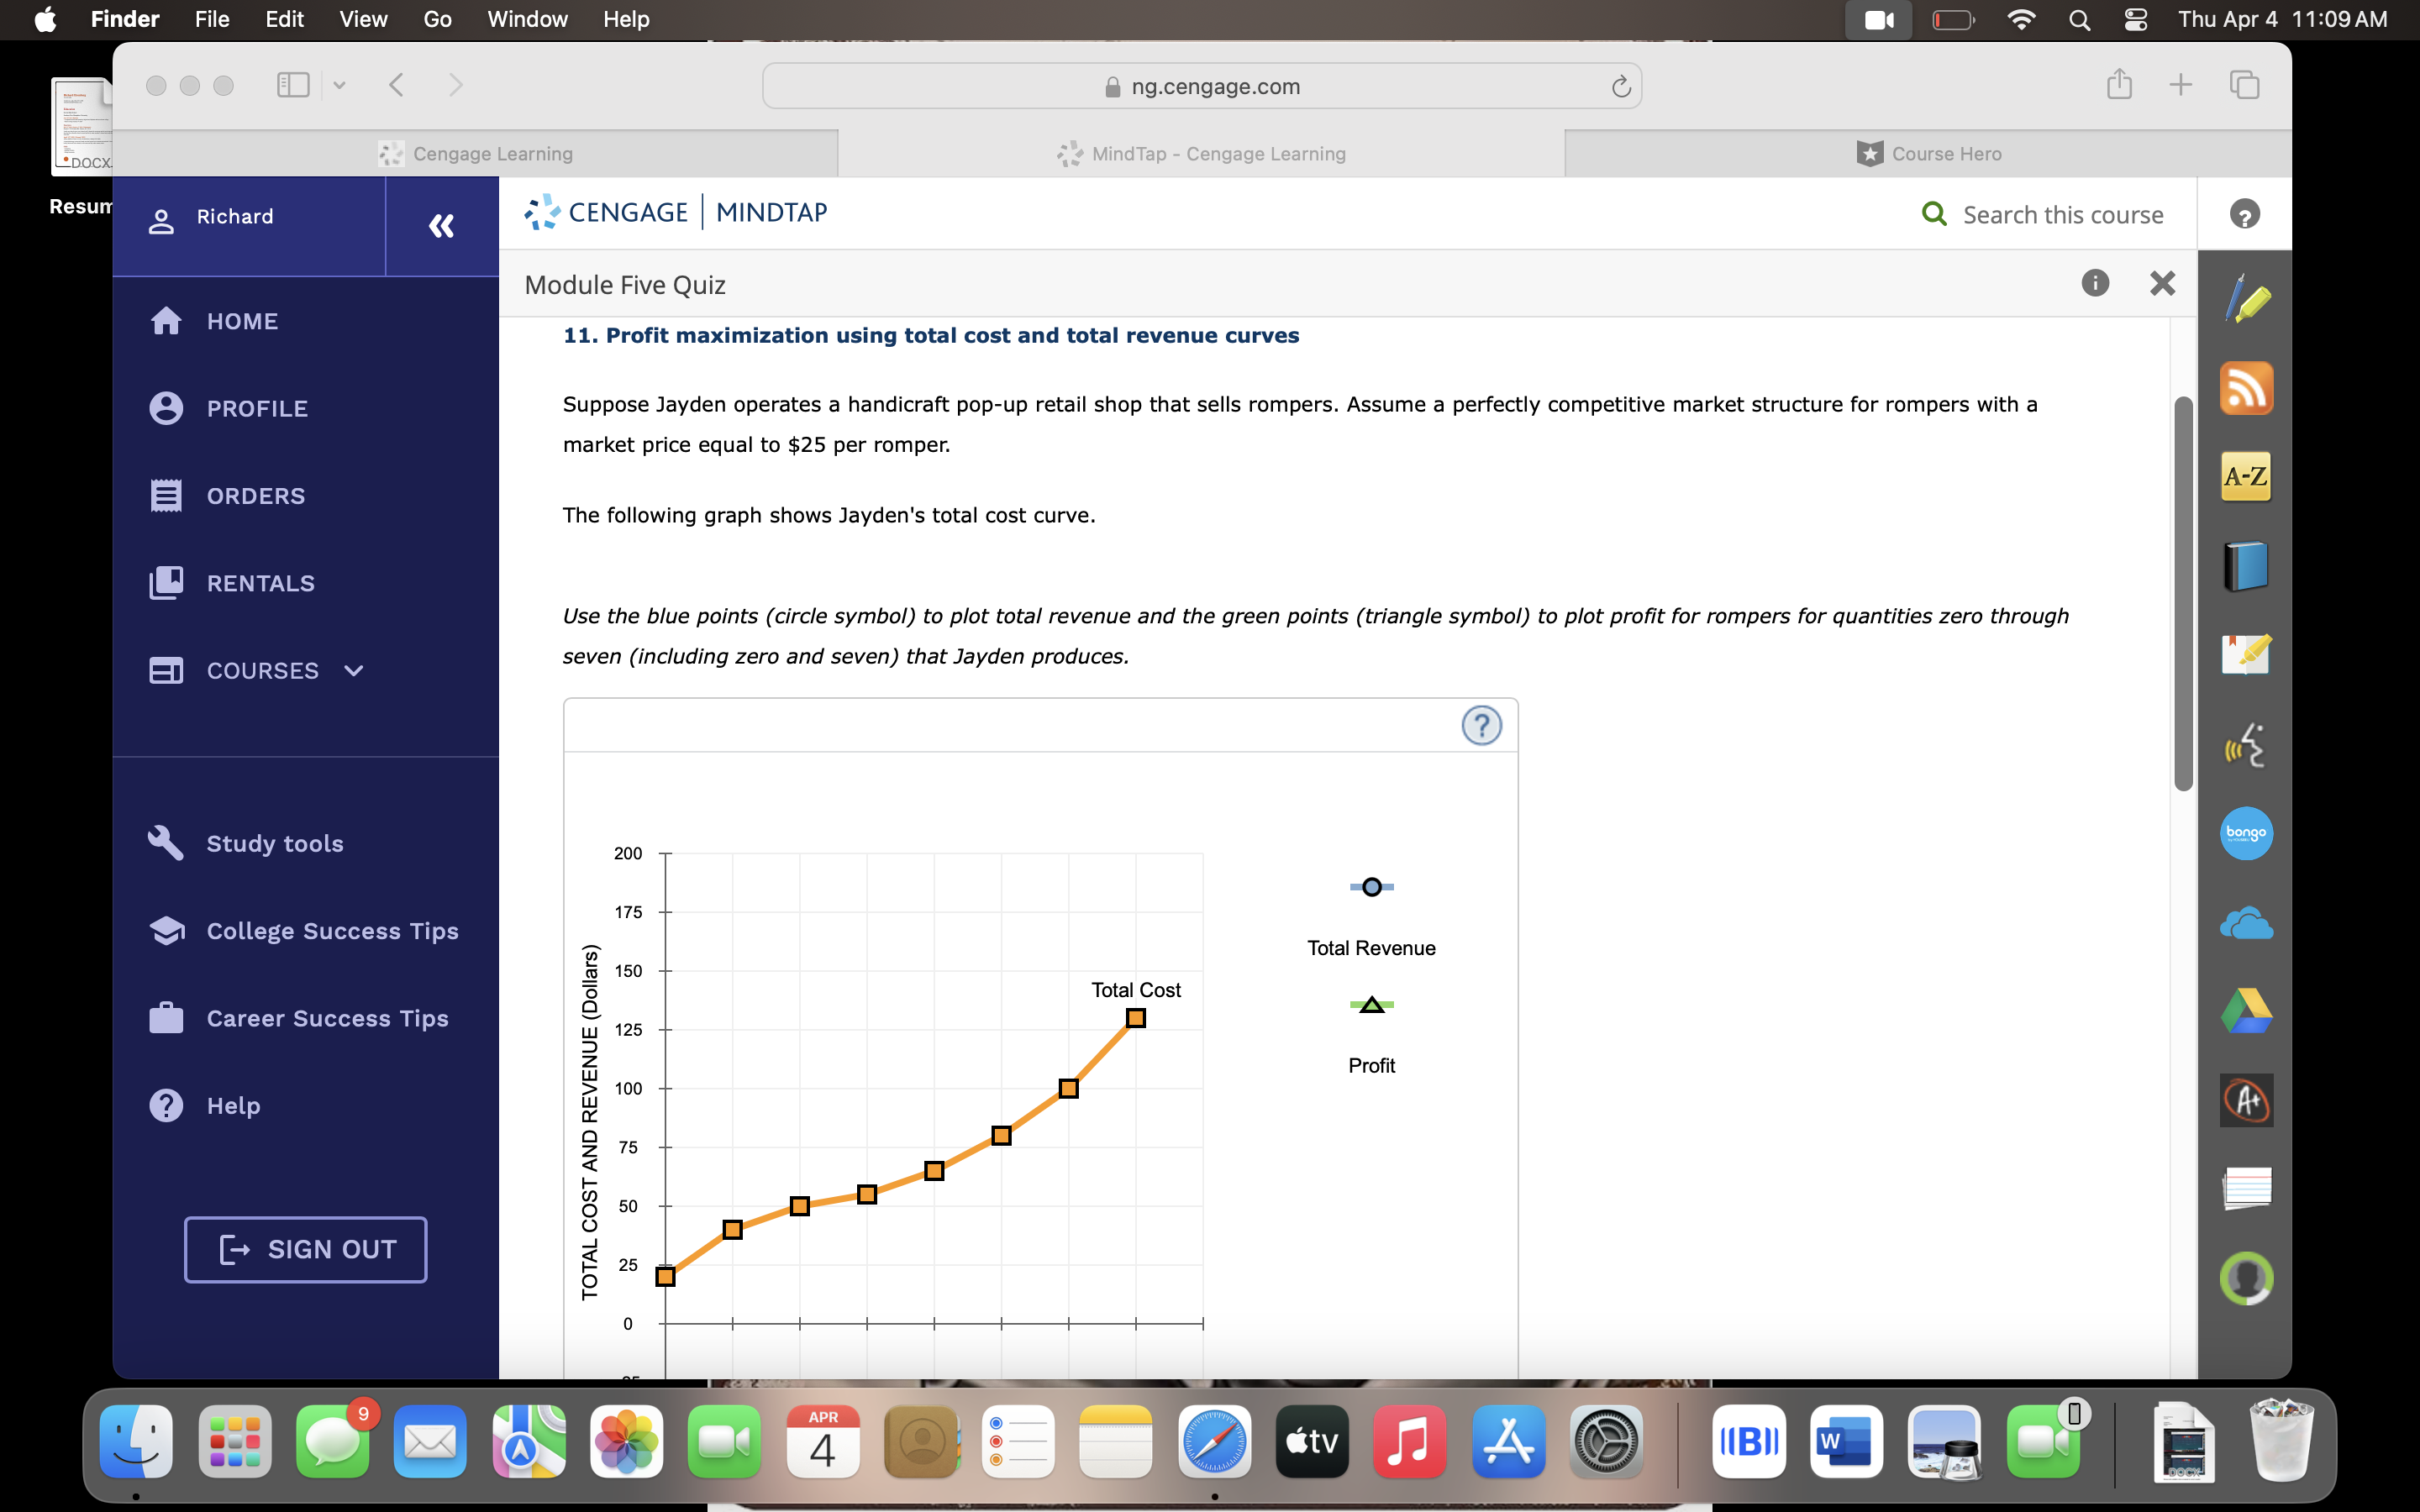
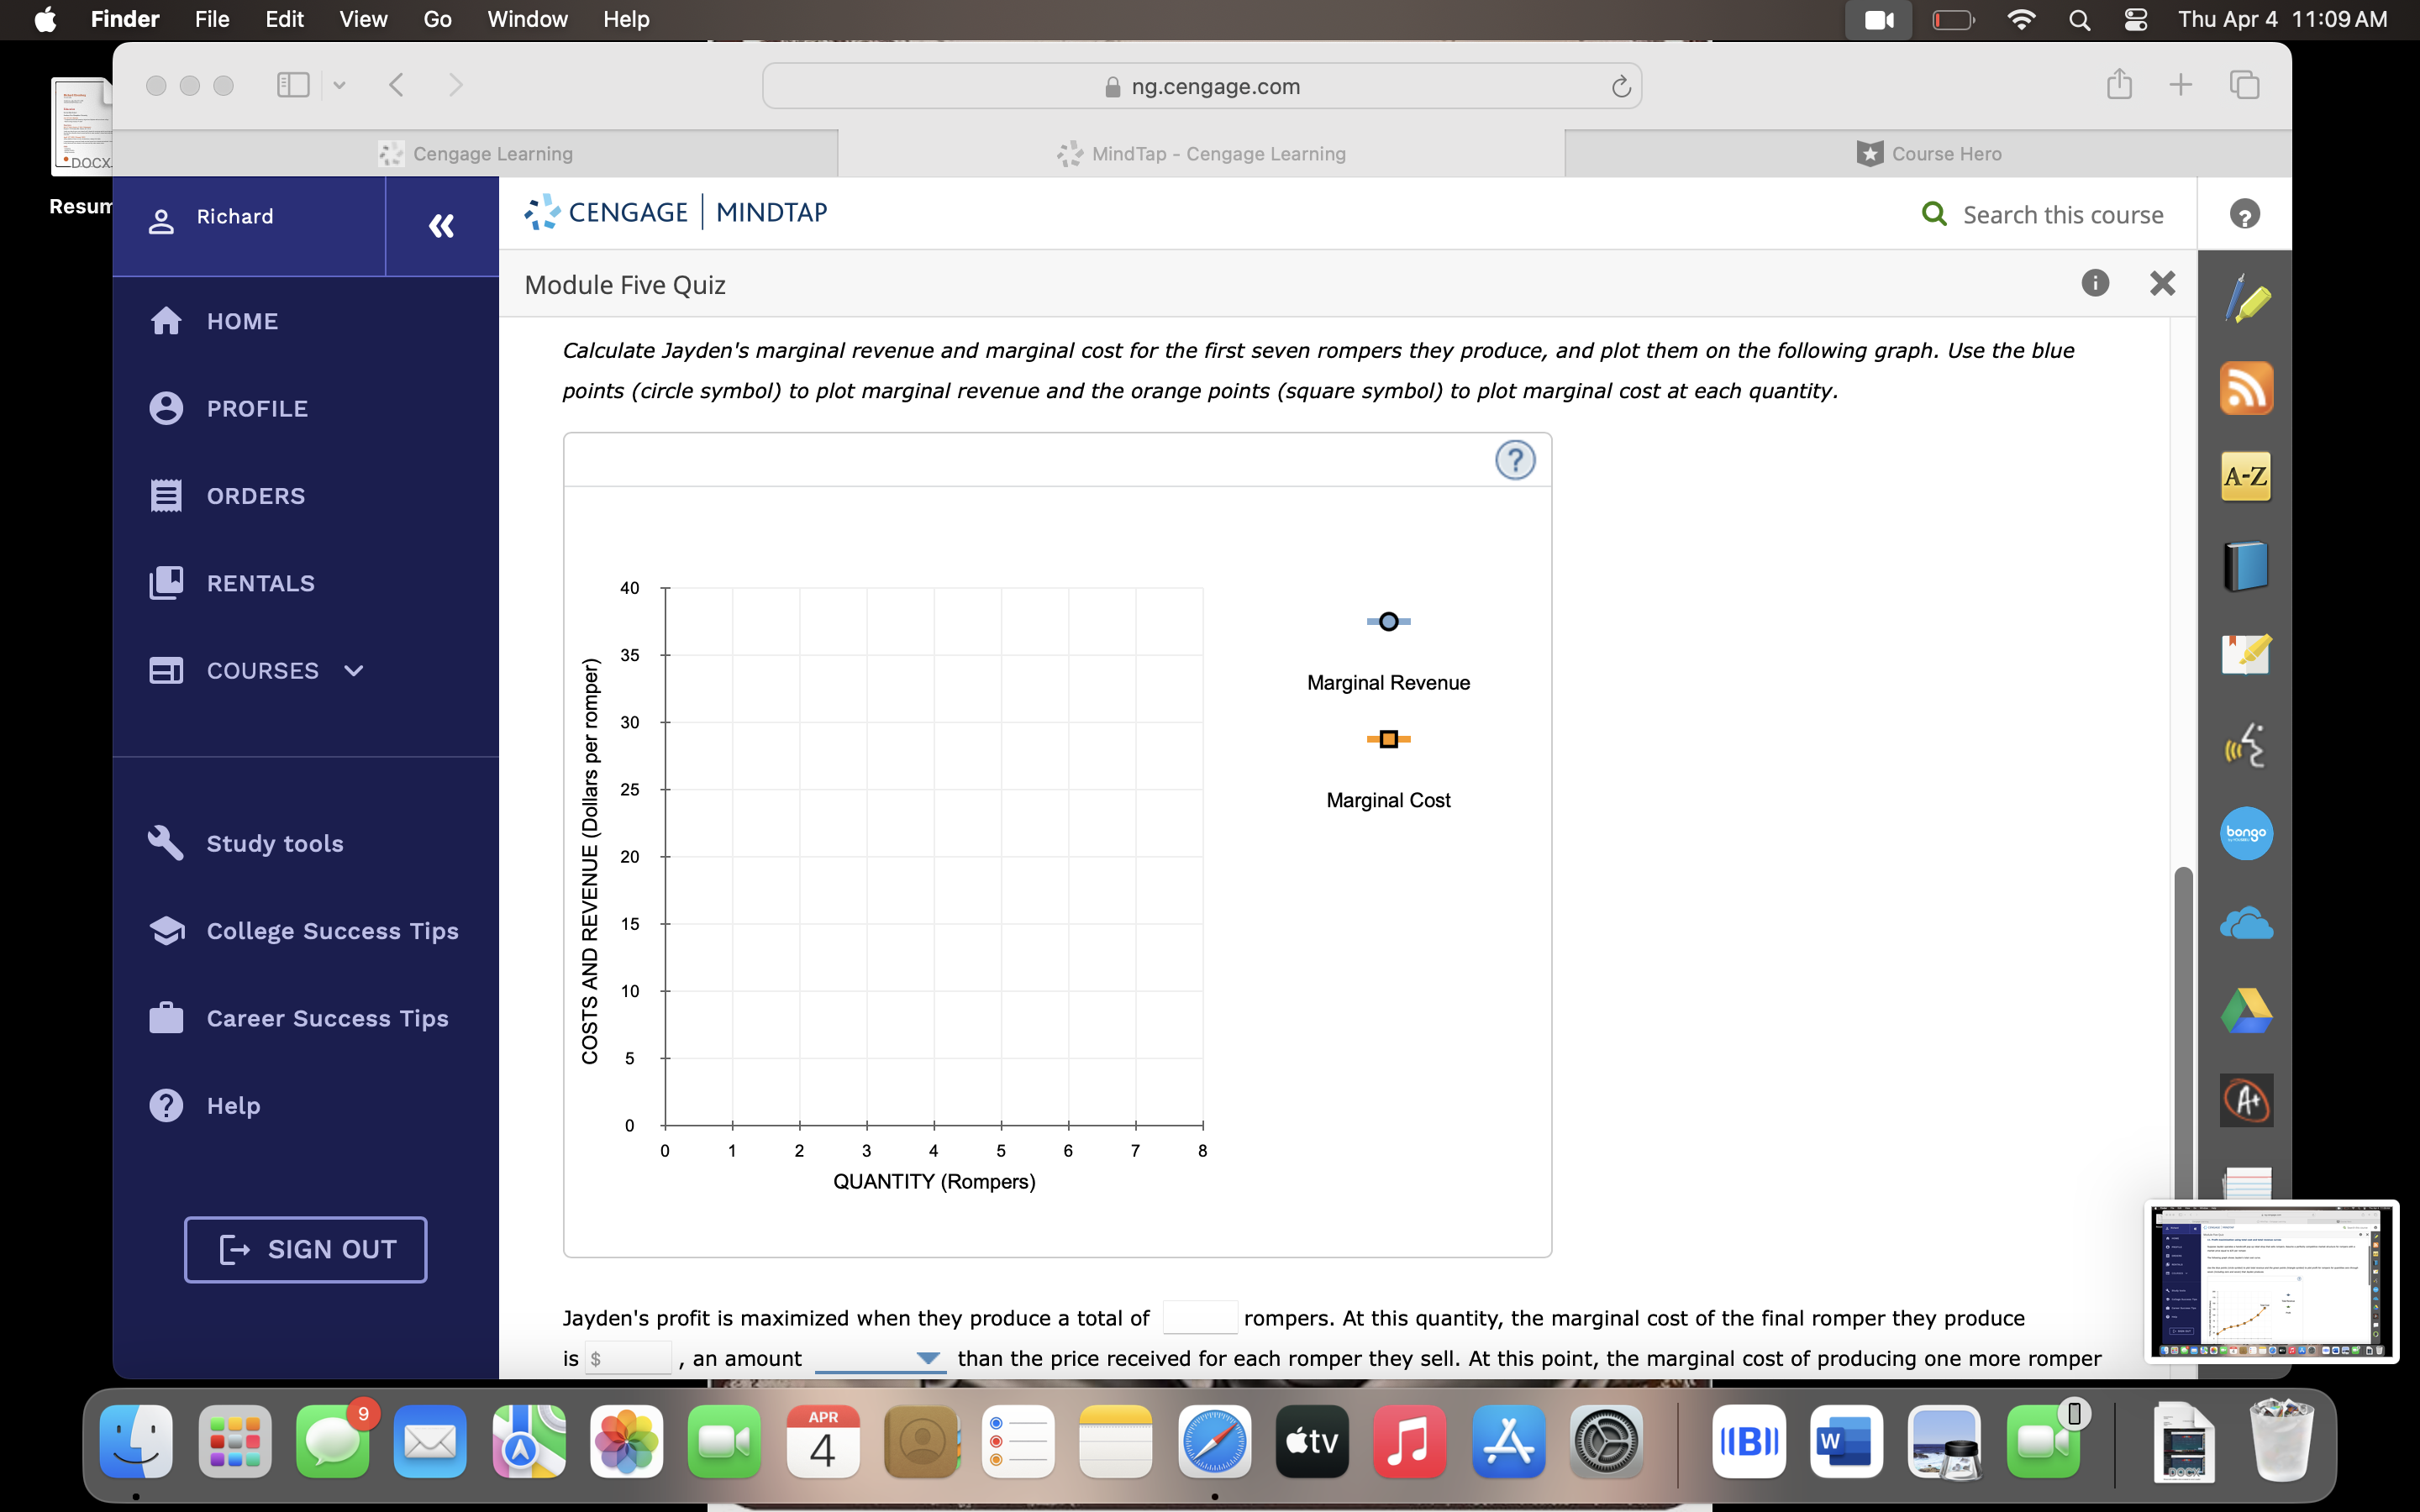
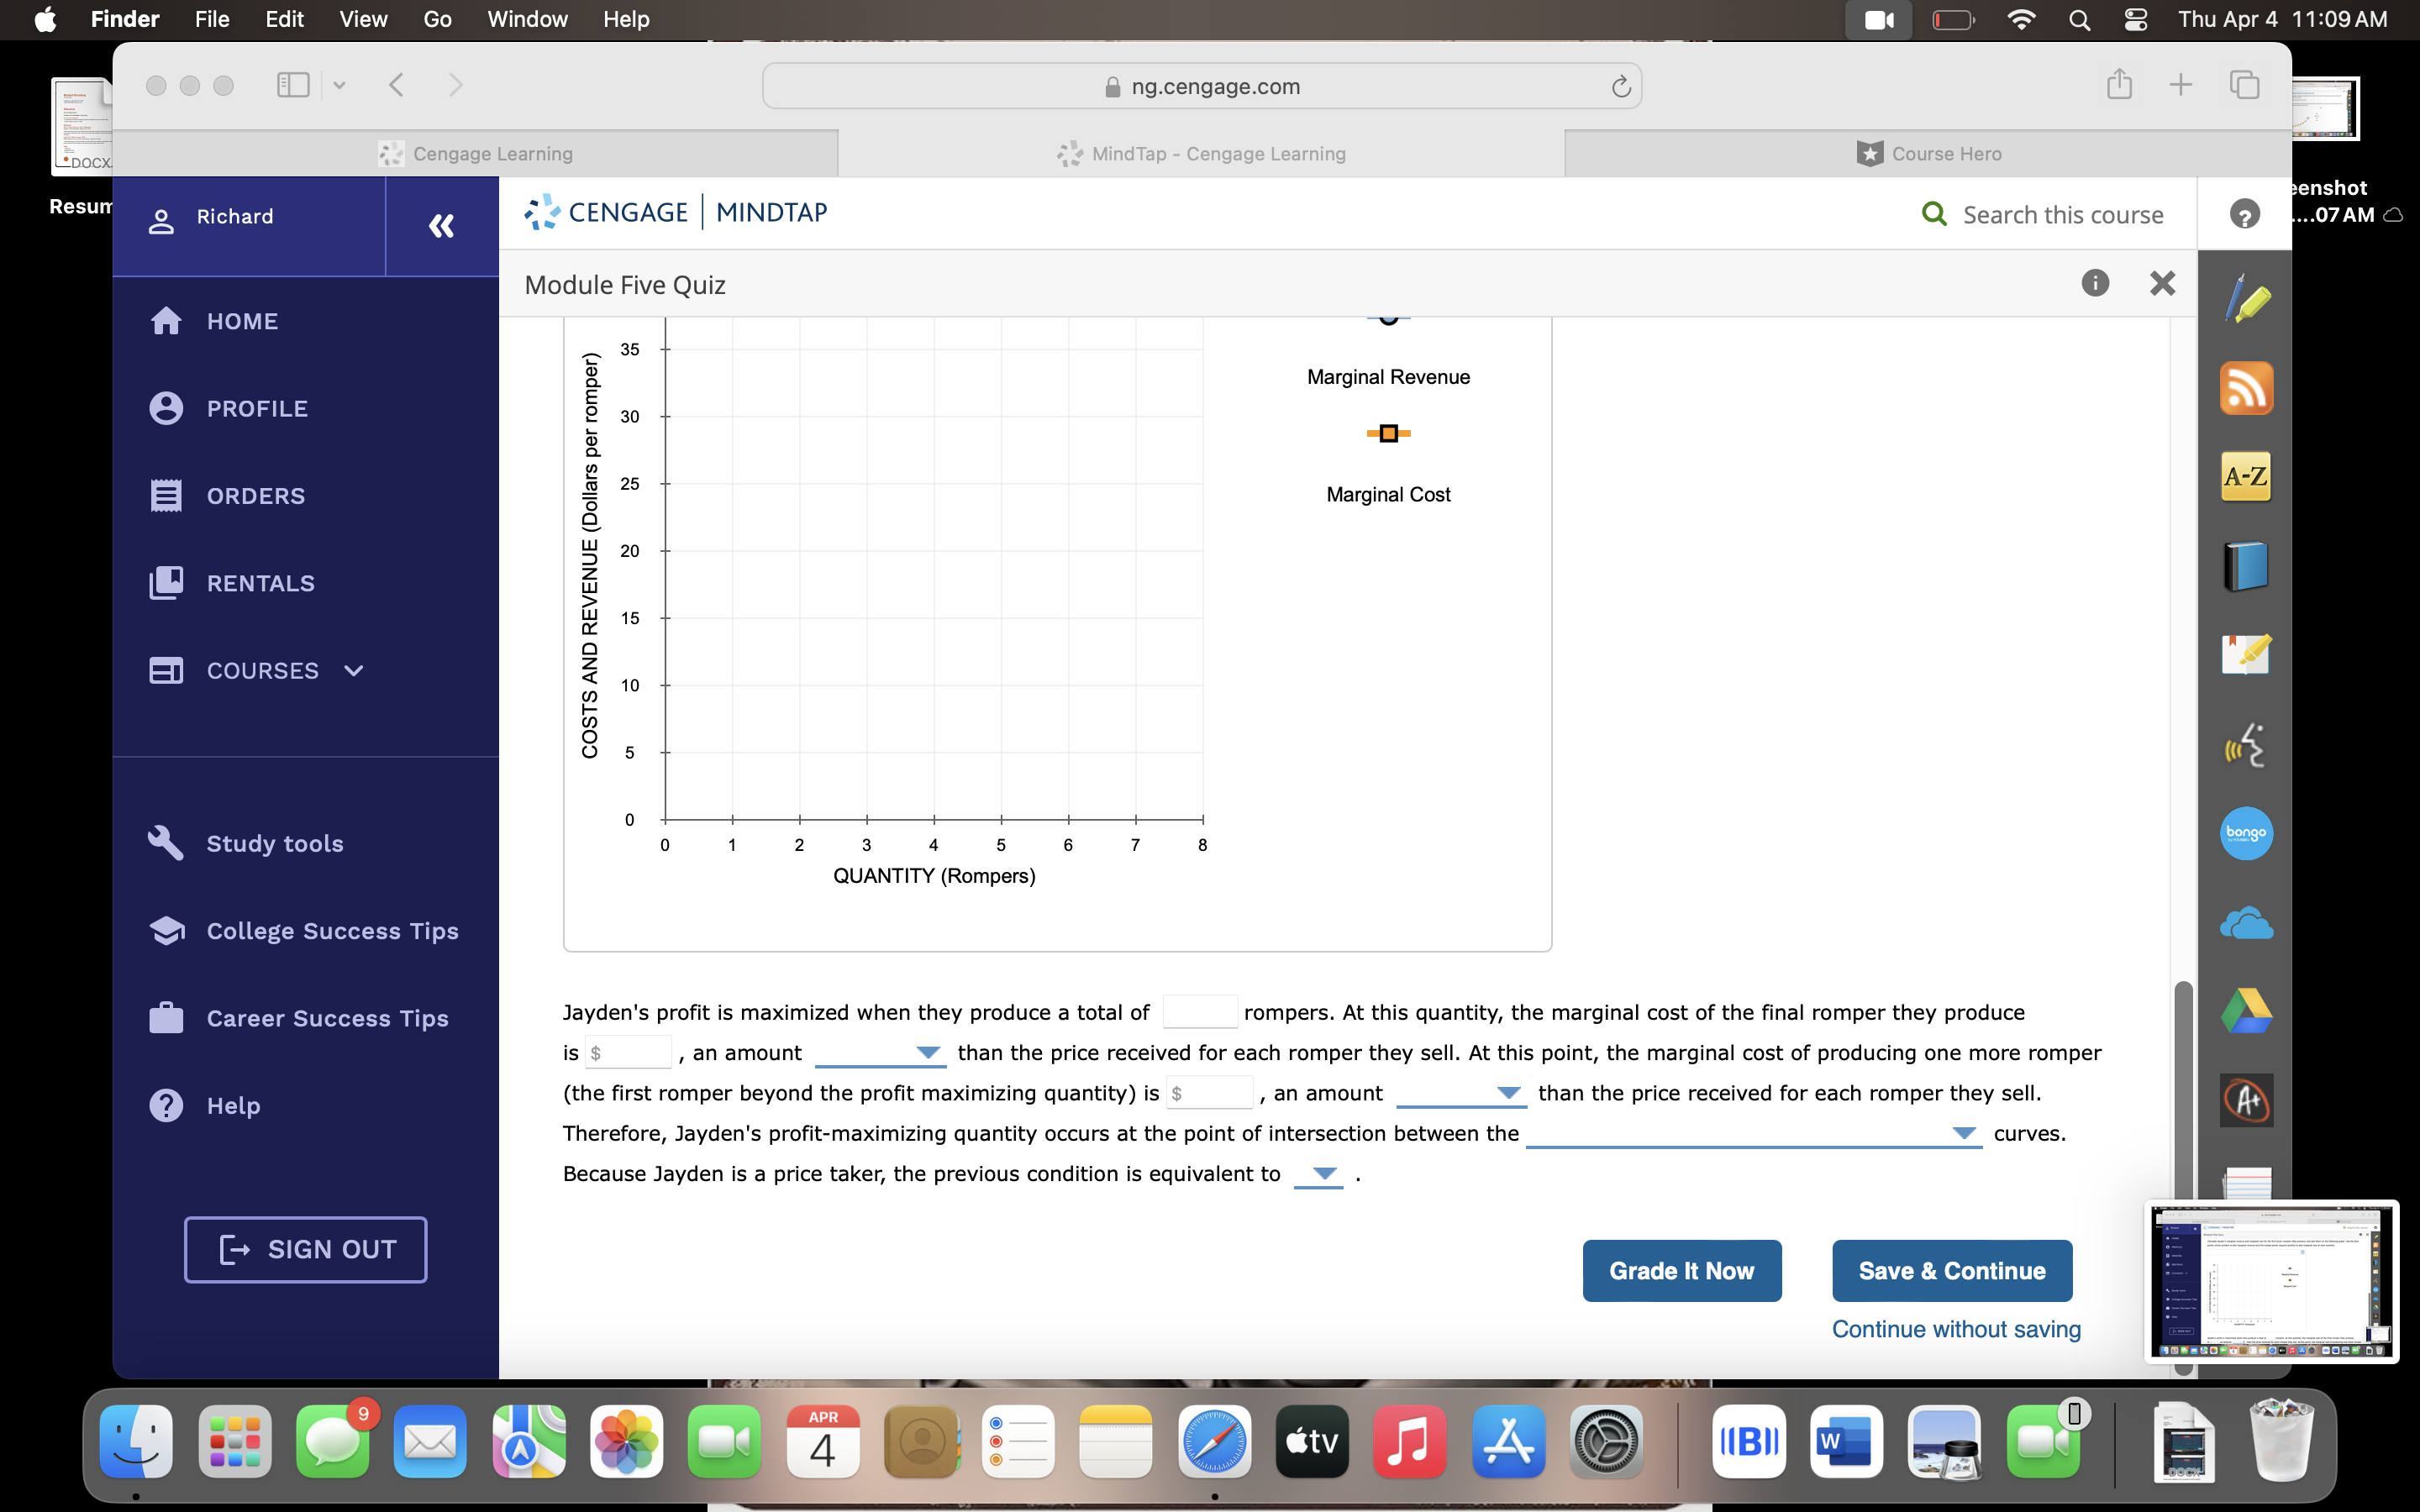
d Finder File Edit View Go Window Help & ThuApr4 11:09AM @ ng.cengage.com LERT LT :W CENGAGE ' MINDTAP Q search this course Module Five Quiz @ X 11. Profit maximization using total cost and total revenue curves PROFILE Suppose Jayden operates a handicraft pop-up retail shop that sells rompers. Assume a perfectly competitive market structure for rompers with a market price equal to $25 per romper. ORDERS The following graph shows Jayden's total cost curve. RENTALS Use the blue points (circle symbol) to plot total revenue and the green points (triangle symbol) to plot profit for rompers for quantities zero through (o N 2 IR seven (including zero and seven) that Jayden produces. Study tools O College Success Tips Total Revenue Total Cost o A Career Success Tips @ 0 Help | i [c]\\o) TOTAL COST AND REVENUE (Dollars) d Finder File Edit View Go Window Help & ThuApr4 11:09AM @ ng.cengage.com LERT LT :W CENGAGE ' MINDTAP Q search this course Module Five Quiz @ X Calculate Jayden's marginal revenue and marginal cost for the first seven rompers they produce, and plot them on the following graph. Use the blue NS points (circle symbol) to plot marginal revenue and the orange points (square symbol) to plot marginal cost at each quantity. () @ ORDERS RENTALS o COURSES v Marginal Revenue o Marginal Cost Study tools College Success Tips Career Success Tips 8 E e 8 8 o s 5 Q w > = w > w o o & w a Z
Step by Step Solution
There are 3 Steps involved in it

Get step-by-step solutions from verified subject matter experts