

Question: ... D H J K L M N O P Q B Year 1977 1978 E Quarterly return - CRE_Denver_CO 1 2. Quartely return -
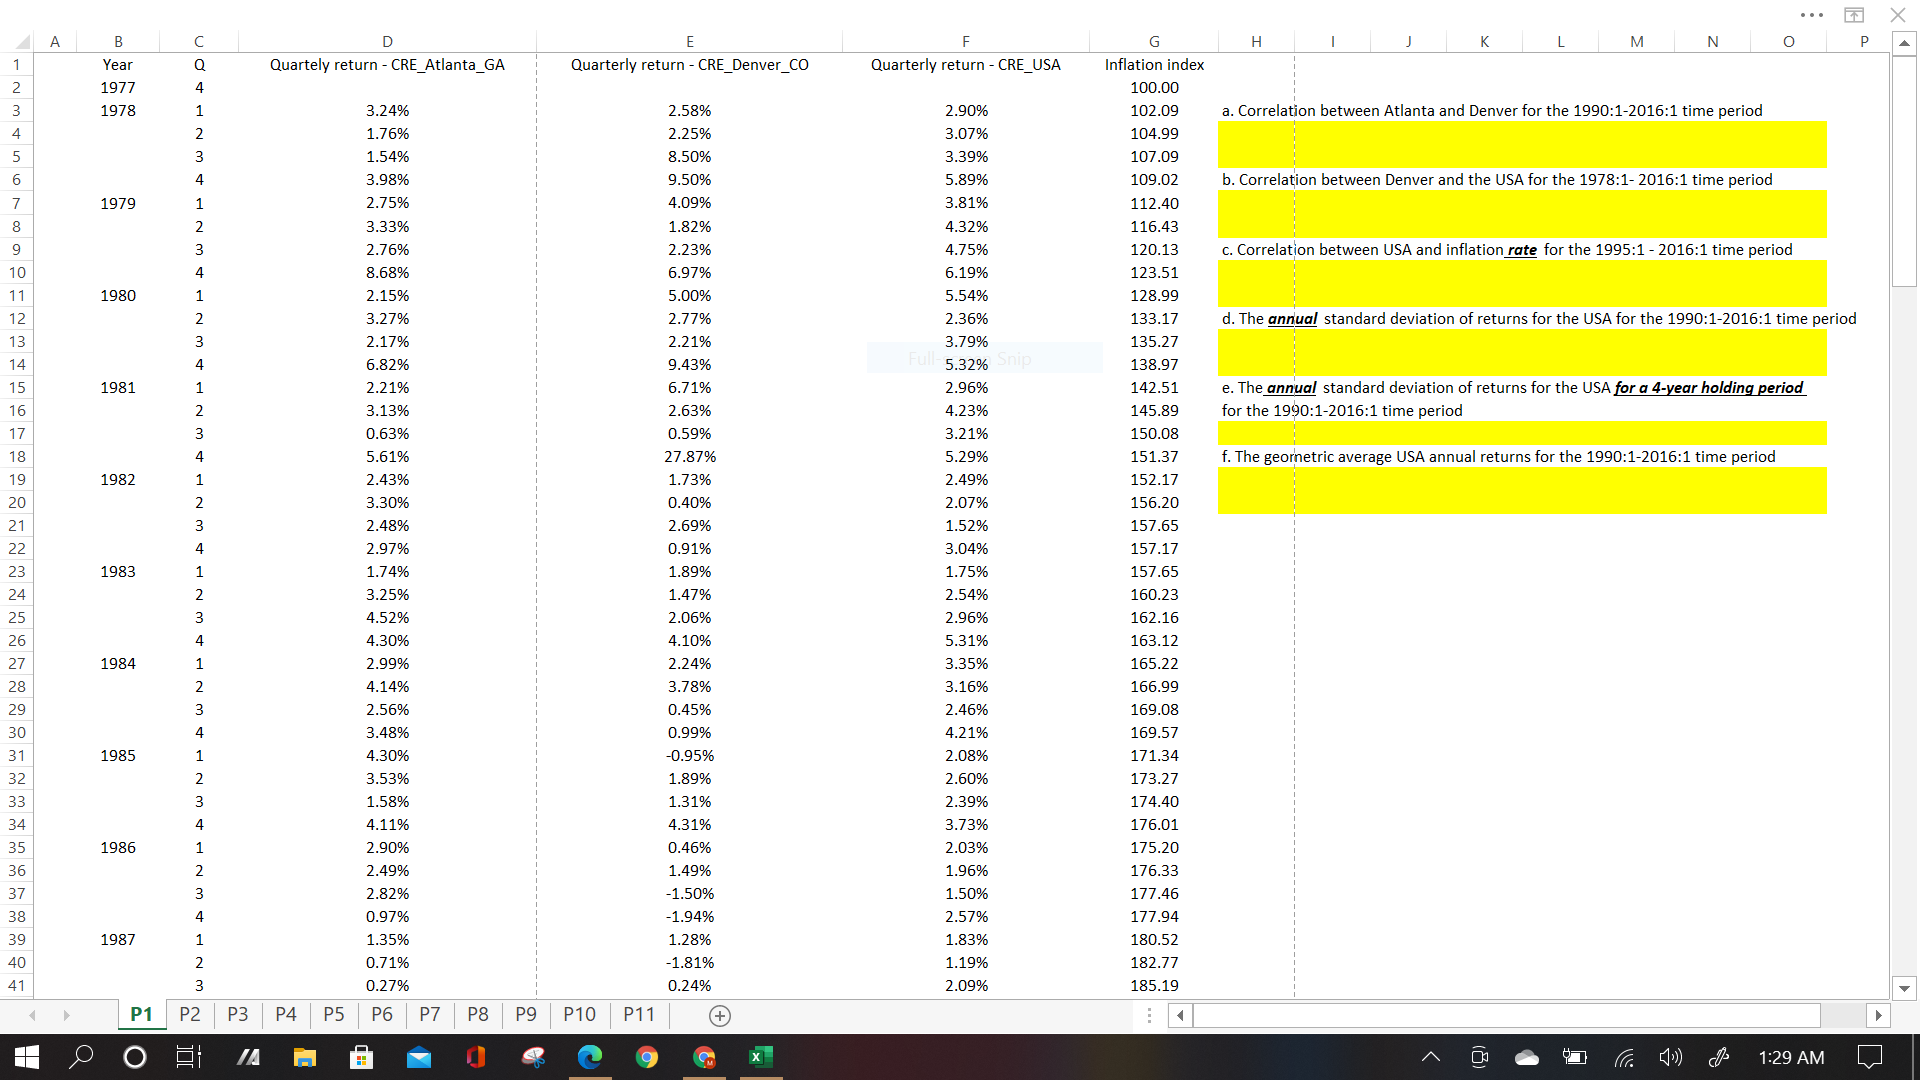
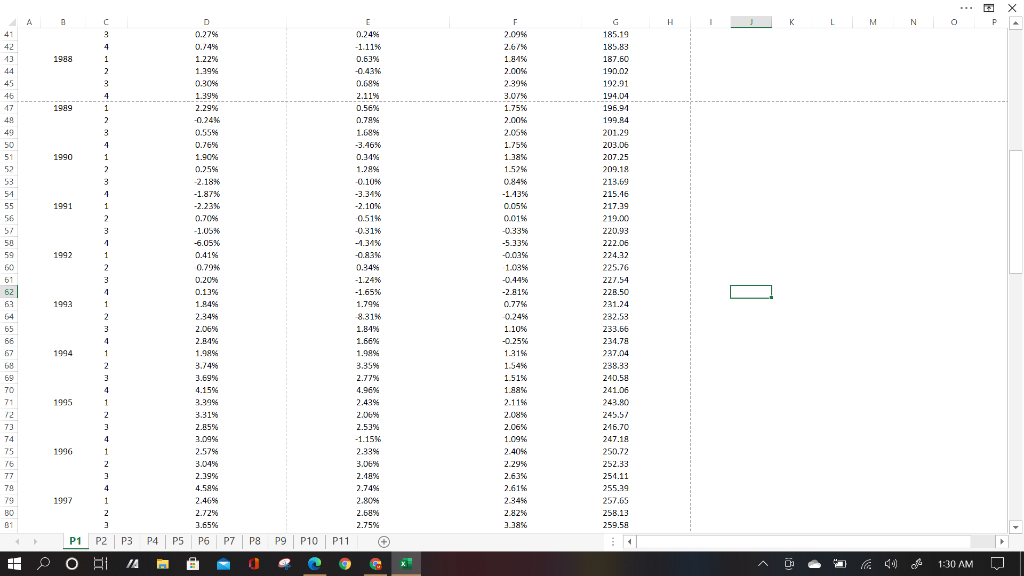
... D H J K L M N O P Q B Year 1977 1978 E Quarterly return - CRE_Denver_CO 1 2. Quartely return - CRE_Atlanta_GA F Quarterly return - CRE_USA 4 3 1 a. Correlation between Atlanta and Denver for the 1990:1-2016:1 time period 4 2 5 3 6 4 b. Correlation between Denver and the USA for the 1978:1-2016:1 time period 7 1979 1 2 2.90% 3.07% 3.39% 5.89% 3.81% 4.32% 4.75% 6.19% 5.54% 2.36% 3.79% 3 C. Correlation between USA and inflation rate for the 1995:1 - 2016:1 time period 4 1980 1 2 d. The annual standard deviation of returns for the USA for the 1990:1-2016:1 time period 3 4 5.32% Sni 1981 1 e. The annual standard deviation of returns for the USA for a 4-year holding period for the 1990:1-2016:1 time period 2 3 4 f. The geometric average USA annual returns for the 1990:1-2016:1 time period 1982 1 2 3 4 3.24% 1.76% 1.54% 3.98% 2.75% 3.33% 2.76% 8.68% 2.15% 3.27% 2.17% 6.82% 2.21% 3.13% 0.63% 5.61% 2.43% 3.30% 2.48% 2.97% 1.74% 3.25% 4.52% 4.30% 2.99% 4.14% 2.56% 3.48% 4.30% 3.53% 1.58% 4.11% 2.90% 2.49% 2.82% 0.97% 1.35% 0.71% 0.27% 2.58% 2.25% 8.50% 9.50% 4.09% 1.82% 2.23% 6.97% 5.00% 2.77% 2.21% 9.43% 6.71% 2.63% 0.59% 27.87% 1.73% 0.40% 2.69% 0.91% 1.89% 1.47% 2.06% 4.10% 2.24% 3.78% 0.45% 0.99% -0.95% 1.89% 1.31% 4.31% 0.46% 1.49% -1.50% -1.94% 1.28% -1.81% 0.24% G Inflation index 100.00 102.09 104.99 107.09 109.02 112.40 116.43 120.13 123.51 128.99 133.17 135.27 138.97 142.51 145.89 150.08 151.37 152.17 156.20 157.65 157.17 157.65 160.23 162.16 163.12 165.22 166.99 169.08 169.57 171.34 173.27 174.40 176.01 175.20 176.33 177.46 177.94 180.52 182.77 185.19 8 9 10 11 12 13 14 15 16 17 18 19 20 21 22 23 24 25 26 27 28 29 30 31 32 33 34 35 36 37 38 39 40 41 1983 1 2 3 4 1984 1 2.96% 4.23% 3.21% 5.29% 2.49% 2.07% 1.52% 3.04% 1.75% 2.54% 2.96% 5.31% 3.35% 3.16% 2.46% 4.21% 2.08% 2.60% 2.39% 3.73% 2.03% 1.96% 1.50% 2.57% 1.83% 1.19% 2.09% 2 3 4 1985 1 2 3 4 1986 1 2 3 4 1987 1 2 3 P1 P2 P3 P4 P5 P6 P7 P8 P9 P10 P11 + E 1:29 AM X A B E H L M N P C 3 41 42 13 4 1988 1 2 3 46 4 1989 1 2 3 49 49 50 51 52 53 1990 4 1 2 3 54 55 56 1991 4 1 2 3 1 1 2 1992 58 59 60 61 621 63 D 0.27% 0.74% 1.22% 1.39% 0.30% 1.39% 2.29% -0.24% 0.55% 0.76% 1.90% 0.25% -2.18% -1.87% -2.23% 0.70% -1.05% -6.05% 0.41% 0.79% 0.20% 0.13% 1.94% 2.34% 2.06% 2.84% 1.989 3.74% 3.69% 4.15% 3.39% 3.31% 2.85% 3.09% 2.57% 3,04% 2.39% 4.58% 2.46% 2.72% 3.65% P4 P5 P6 P7 P8 P9 P10 P11 F 2.0956 2.67% 1 844 2.00% 2.3956 3.07% 1.75% 2.00% 2.0666 1.75% 1.38% 1.52 0.84% -1.13% 0.05% 0.0156 -0.33% -5.33% -0.03% 1.08% -0.44% -2.81% 0.7756 -0.24% 1.10% -0.25% 1.31% 1.54% 1.51% 1.88% 2.11% 2.08% 2.06% 1.09% 2.40% 2.29% 2.63% 2.61% 2.3456 2.82% 3.38% 0.24% -1.11% 0.63% -0.43% 0.699 2.11% 0.56% 0.799 1.68% -3.46% 0.34% 1.29% -0.10% -3.34% -2.10% 0.51% -0.31% -1.31% -0.83 0.34% -1.24% -1.65% 1.79% 8.31% 1.84% 1.66% 1.99% 3.35% 2.77% 4.96% 2.439 2.06% 2.53% -1.15% 2.3394 3.06% 2.18% 2.74% 2.80% 2.68% 2.75% 3 4 1 2 3 4 1 185.19 185.83 187.60 190.02 192.91 194.04 196.94 199.84 201.29 203.06 207.25 209.19 213.69 215.16 217.29 219.00 220.93 222.06 224.22 225.76 227.54 228.50 231.24 232.53 233.56 234.78 237.04 238.33 240.59 241.06 243.80 245.57 246.70 247.18 250.72 252.33 254.11 255.29 257.68 258.13 259.58 1993 64 65 66 1994 68 69 70 71 1995 1996 73 74 75 76 77 79 79 80 BE 2 3 4 1 1 2 3 4 1 2 3 4 1 2 3 1997 P1 + P2 P3 AI /A H O x (10) G 1:30 AM JIKI 4 3 P1 P2 P3 P4 P5 P6 P7 P8 P9 P10 P11 . 1 TTT . 1 ] Q Q ___ 2009 2012 2014 4m m4 m m P1_P2|p3_P4| P5_P6_P7 |P8_P9 | P10 | P11 0 OHABB - 1 a ... D H J K L M N O P Q B Year 1977 1978 E Quarterly return - CRE_Denver_CO 1 2. Quartely return - CRE_Atlanta_GA F Quarterly return - CRE_USA 4 3 1 a. Correlation between Atlanta and Denver for the 1990:1-2016:1 time period 4 2 5 3 6 4 b. Correlation between Denver and the USA for the 1978:1-2016:1 time period 7 1979 1 2 2.90% 3.07% 3.39% 5.89% 3.81% 4.32% 4.75% 6.19% 5.54% 2.36% 3.79% 3 C. Correlation between USA and inflation rate for the 1995:1 - 2016:1 time period 4 1980 1 2 d. The annual standard deviation of returns for the USA for the 1990:1-2016:1 time period 3 4 5.32% Sni 1981 1 e. The annual standard deviation of returns for the USA for a 4-year holding period for the 1990:1-2016:1 time period 2 3 4 f. The geometric average USA annual returns for the 1990:1-2016:1 time period 1982 1 2 3 4 3.24% 1.76% 1.54% 3.98% 2.75% 3.33% 2.76% 8.68% 2.15% 3.27% 2.17% 6.82% 2.21% 3.13% 0.63% 5.61% 2.43% 3.30% 2.48% 2.97% 1.74% 3.25% 4.52% 4.30% 2.99% 4.14% 2.56% 3.48% 4.30% 3.53% 1.58% 4.11% 2.90% 2.49% 2.82% 0.97% 1.35% 0.71% 0.27% 2.58% 2.25% 8.50% 9.50% 4.09% 1.82% 2.23% 6.97% 5.00% 2.77% 2.21% 9.43% 6.71% 2.63% 0.59% 27.87% 1.73% 0.40% 2.69% 0.91% 1.89% 1.47% 2.06% 4.10% 2.24% 3.78% 0.45% 0.99% -0.95% 1.89% 1.31% 4.31% 0.46% 1.49% -1.50% -1.94% 1.28% -1.81% 0.24% G Inflation index 100.00 102.09 104.99 107.09 109.02 112.40 116.43 120.13 123.51 128.99 133.17 135.27 138.97 142.51 145.89 150.08 151.37 152.17 156.20 157.65 157.17 157.65 160.23 162.16 163.12 165.22 166.99 169.08 169.57 171.34 173.27 174.40 176.01 175.20 176.33 177.46 177.94 180.52 182.77 185.19 8 9 10 11 12 13 14 15 16 17 18 19 20 21 22 23 24 25 26 27 28 29 30 31 32 33 34 35 36 37 38 39 40 41 1983 1 2 3 4 1984 1 2.96% 4.23% 3.21% 5.29% 2.49% 2.07% 1.52% 3.04% 1.75% 2.54% 2.96% 5.31% 3.35% 3.16% 2.46% 4.21% 2.08% 2.60% 2.39% 3.73% 2.03% 1.96% 1.50% 2.57% 1.83% 1.19% 2.09% 2 3 4 1985 1 2 3 4 1986 1 2 3 4 1987 1 2 3 P1 P2 P3 P4 P5 P6 P7 P8 P9 P10 P11 + E 1:29 AM X A B E H L M N P C 3 41 42 13 4 1988 1 2 3 46 4 1989 1 2 3 49 49 50 51 52 53 1990 4 1 2 3 54 55 56 1991 4 1 2 3 1 1 2 1992 58 59 60 61 621 63 D 0.27% 0.74% 1.22% 1.39% 0.30% 1.39% 2.29% -0.24% 0.55% 0.76% 1.90% 0.25% -2.18% -1.87% -2.23% 0.70% -1.05% -6.05% 0.41% 0.79% 0.20% 0.13% 1.94% 2.34% 2.06% 2.84% 1.989 3.74% 3.69% 4.15% 3.39% 3.31% 2.85% 3.09% 2.57% 3,04% 2.39% 4.58% 2.46% 2.72% 3.65% P4 P5 P6 P7 P8 P9 P10 P11 F 2.0956 2.67% 1 844 2.00% 2.3956 3.07% 1.75% 2.00% 2.0666 1.75% 1.38% 1.52 0.84% -1.13% 0.05% 0.0156 -0.33% -5.33% -0.03% 1.08% -0.44% -2.81% 0.7756 -0.24% 1.10% -0.25% 1.31% 1.54% 1.51% 1.88% 2.11% 2.08% 2.06% 1.09% 2.40% 2.29% 2.63% 2.61% 2.3456 2.82% 3.38% 0.24% -1.11% 0.63% -0.43% 0.699 2.11% 0.56% 0.799 1.68% -3.46% 0.34% 1.29% -0.10% -3.34% -2.10% 0.51% -0.31% -1.31% -0.83 0.34% -1.24% -1.65% 1.79% 8.31% 1.84% 1.66% 1.99% 3.35% 2.77% 4.96% 2.439 2.06% 2.53% -1.15% 2.3394 3.06% 2.18% 2.74% 2.80% 2.68% 2.75% 3 4 1 2 3 4 1 185.19 185.83 187.60 190.02 192.91 194.04 196.94 199.84 201.29 203.06 207.25 209.19 213.69 215.16 217.29 219.00 220.93 222.06 224.22 225.76 227.54 228.50 231.24 232.53 233.56 234.78 237.04 238.33 240.59 241.06 243.80 245.57 246.70 247.18 250.72 252.33 254.11 255.29 257.68 258.13 259.58 1993 64 65 66 1994 68 69 70 71 1995 1996 73 74 75 76 77 79 79 80 BE 2 3 4 1 1 2 3 4 1 2 3 4 1 2 3 1997 P1 + P2 P3 AI /A H O x (10) G 1:30 AM JIKI 4 3 P1 P2 P3 P4 P5 P6 P7 P8 P9 P10 P11 . 1 TTT . 1 ] Q Q ___ 2009 2012 2014 4m m4 m m P1_P2|p3_P4| P5_P6_P7 |P8_P9 | P10 | P11 0 OHABB - 1 a
Step by Step Solution
There are 3 Steps involved in it

Get step-by-step solutions from verified subject matter experts