

Question: d. In the graph below, indicate the old and new steady state in the economy clearly. Then show (by marking the appropriate distance in the
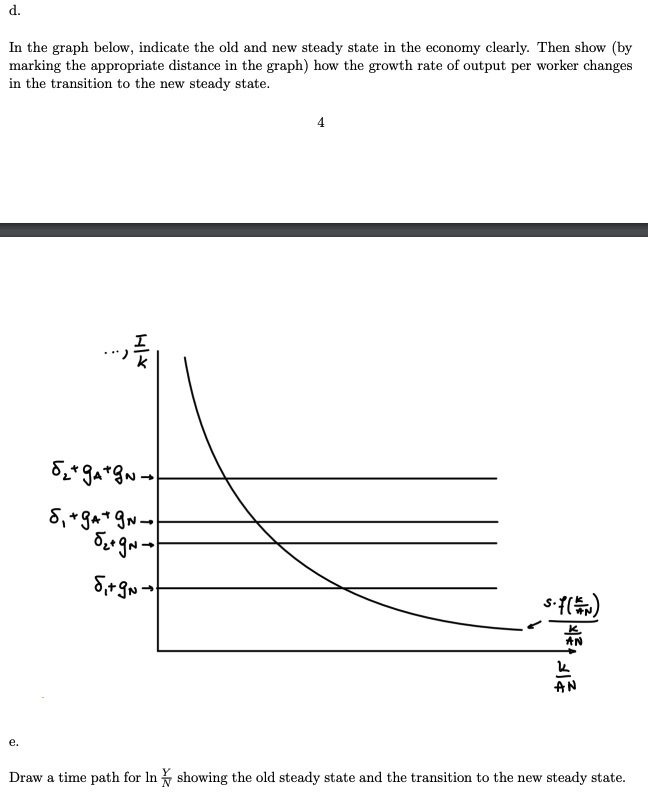
d. In the graph below, indicate the old and new steady state in the economy clearly. Then show (by marking the appropriate distance in the graph) how the growth rate of output per worker changes in the transition to the new steady state. 81 +94+9N-. 82+90- 8,+9N- AN AN e. Draw a time path for In # showing the old steady state and the transition to the new steady state
Step by Step Solution
There are 3 Steps involved in it
1 Expert Approved Answer
Step: 1 Unlock

Question Has Been Solved by an Expert!
Get step-by-step solutions from verified subject matter experts
Step: 2 Unlock
Step: 3 Unlock