

Question: d: Mar 24 at 8:39pm niz Instructions Question 1 2 pts In an investigation of the relationship between SAT scores and gradepoint average GPA of
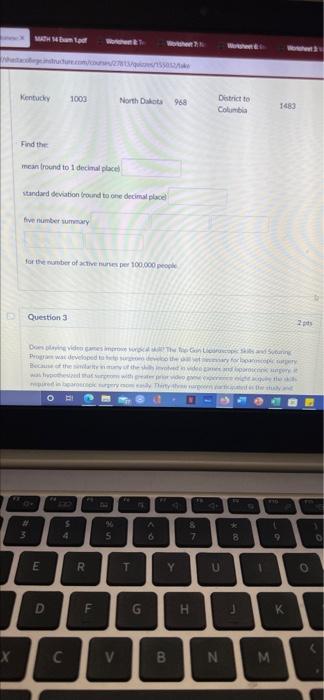
d: Mar 24 at 8:39pm niz Instructions Question 1 2 pts In an investigation of the relationship between SAT scores and gradepoint average GPA of college students, which of the following graphs is most helpt histogram, pie chart waterplot stimplot: o dotplot How Pent O Sitter Det Question 2 ats Where the theatre 100.000 5 s wo un 5 0 9 0 V E R T T Y 0 1 S D F G . 3 K X V B N M Alt Mama Wor Kentucky 1000 North Dakota 968 District to Columbia 1483 Find the mentround to 1 decimal place standard deviation round to one decimal place five number summary for the number of times per 100.000 people Question 3 2 Do Video Scaring Pro devedor Beche th beint O S 4 & 7 3 5 6 E R T Y D F G . j K K X C V B N M
Step by Step Solution
There are 3 Steps involved in it

Get step-by-step solutions from verified subject matter experts