

Question: d please Part 2: Two years are picked for you according to your RIN. Y, and Y2 refer to the energy consumptions of a country
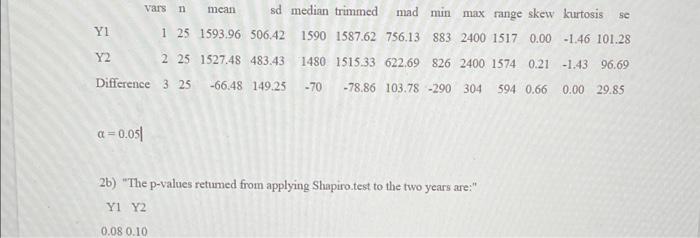
Part 2: Two years are picked for you according to your RIN. Y, and Y2 refer to the energy consumptions of a country in the first and the second year, respectively. Assume that all countries are independent in their energy consumptions. However, the energy consumptions of a country in those two years are not independent a) Copy the original data displayed in R(Y. Y, and Y - Y) and their descriptive statistics b) Copy their p-values from Shapiro's normality tests. Can we assume that the samples are drawn from normal distributions? c) Copy the four figures generated in R. Comment on the advantages and/or disadvantages of cach figure in comparing the energy consumptions of two years. d) Can we claim that a country has a change of Ao in energy consumption over the chosen two years? The claimed value A. can be found in your Routput. That is to test Hot Hy MY = A, versus Ha! HY HY WA Show the confidence interval method in your hand calculation Y1 Vars 11 mcan sd median trimmed mad min max range skew kurtosis se 1 25 1593.96 506.42 1590 1587.62 756.13 883 2400 1517 0.00 -1.46 101.28 Y2 2 25 1527.48 483.43 1480 1515.33 622.69 826 2400 1574 0.21 -1.43 96.69 Difference 3 25 -66.48 149.25 - 70 -78.86 103.78-290 304 594 0.66 0.00 29.85 a = 0.05 2b) "The p-values retumed from applying Shapiro test to the two years are:" Y Y2 0.08 0.10 Part 2: Two years are picked for you according to your RIN. Y, and Y2 refer to the energy consumptions of a country in the first and the second year, respectively. Assume that all countries are independent in their energy consumptions. However, the energy consumptions of a country in those two years are not independent a) Copy the original data displayed in R(Y. Y, and Y - Y) and their descriptive statistics b) Copy their p-values from Shapiro's normality tests. Can we assume that the samples are drawn from normal distributions? c) Copy the four figures generated in R. Comment on the advantages and/or disadvantages of cach figure in comparing the energy consumptions of two years. d) Can we claim that a country has a change of Ao in energy consumption over the chosen two years? The claimed value A. can be found in your Routput. That is to test Hot Hy MY = A, versus Ha! HY HY WA Show the confidence interval method in your hand calculation Y1 Vars 11 mcan sd median trimmed mad min max range skew kurtosis se 1 25 1593.96 506.42 1590 1587.62 756.13 883 2400 1517 0.00 -1.46 101.28 Y2 2 25 1527.48 483.43 1480 1515.33 622.69 826 2400 1574 0.21 -1.43 96.69 Difference 3 25 -66.48 149.25 - 70 -78.86 103.78-290 304 594 0.66 0.00 29.85 a = 0.05 2b) "The p-values retumed from applying Shapiro test to the two years are:" Y Y2 0.08 0.10
Step by Step Solution
There are 3 Steps involved in it

Get step-by-step solutions from verified subject matter experts