

Question: D Question 1 5 pts 4 Minutes, 23 Seconds The following scatterplot shows the relationship between the age (in years) of 10 randomly selected patients
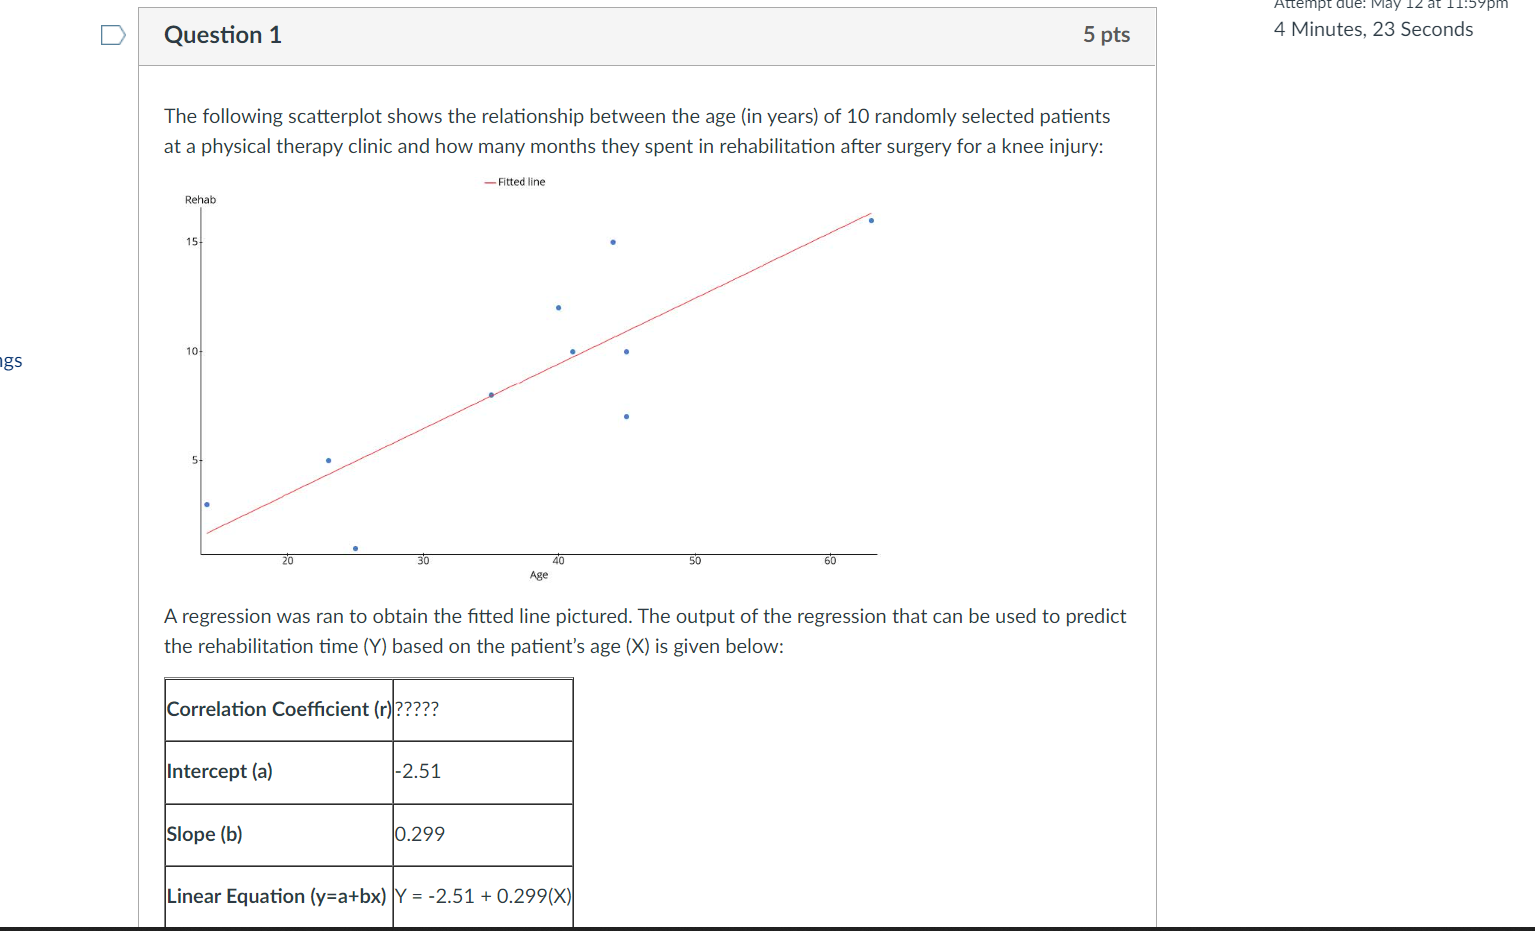
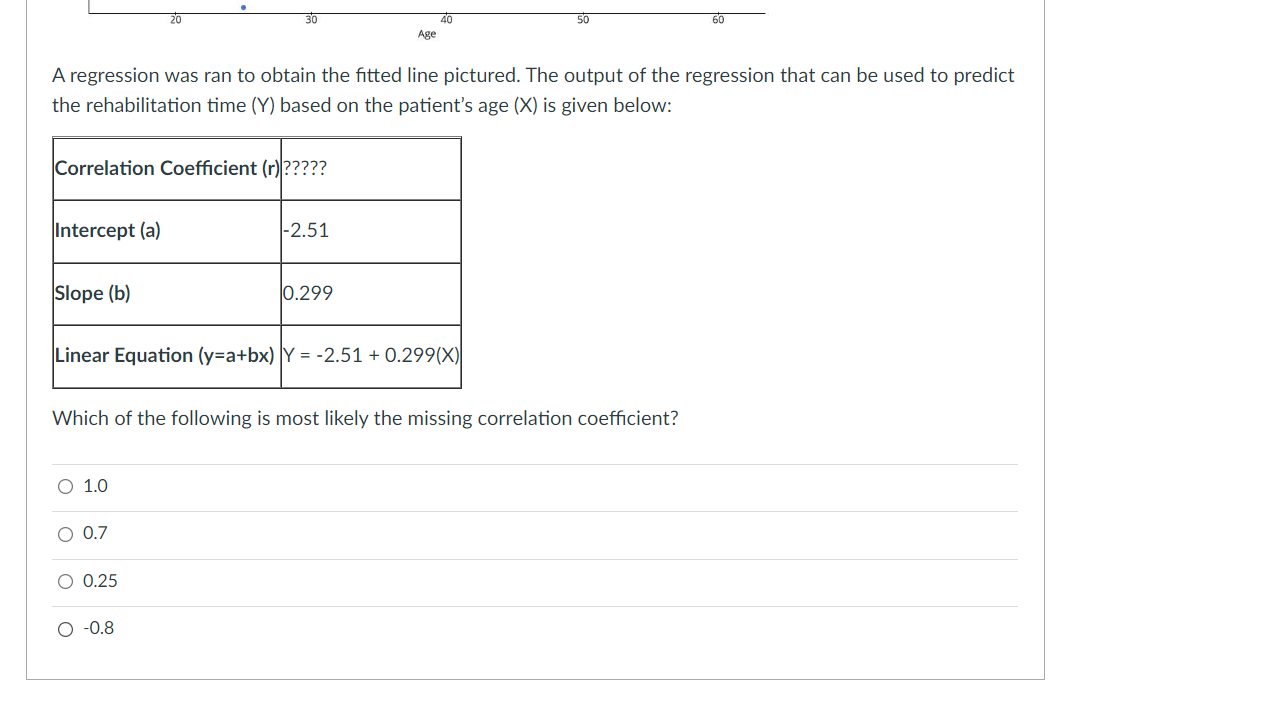
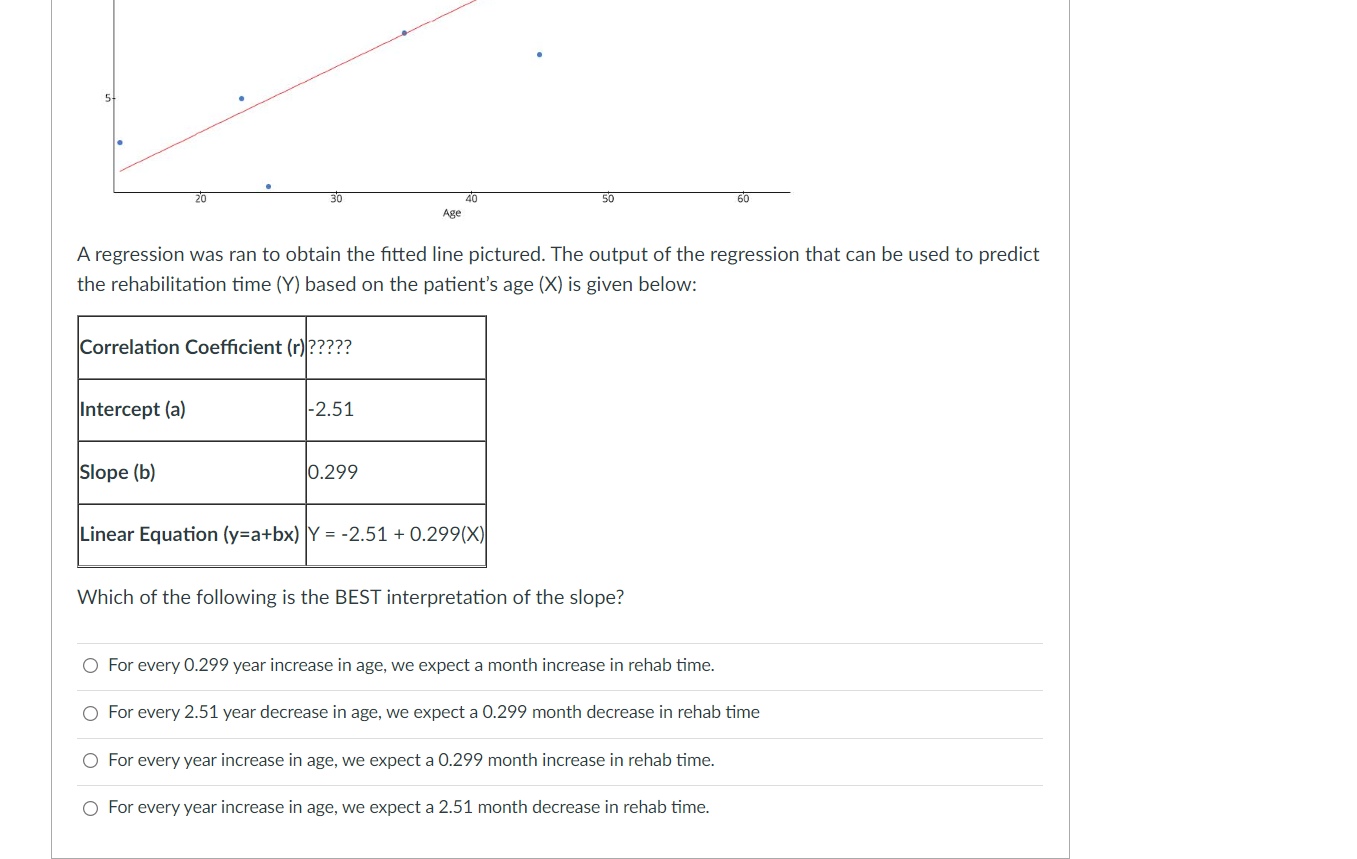
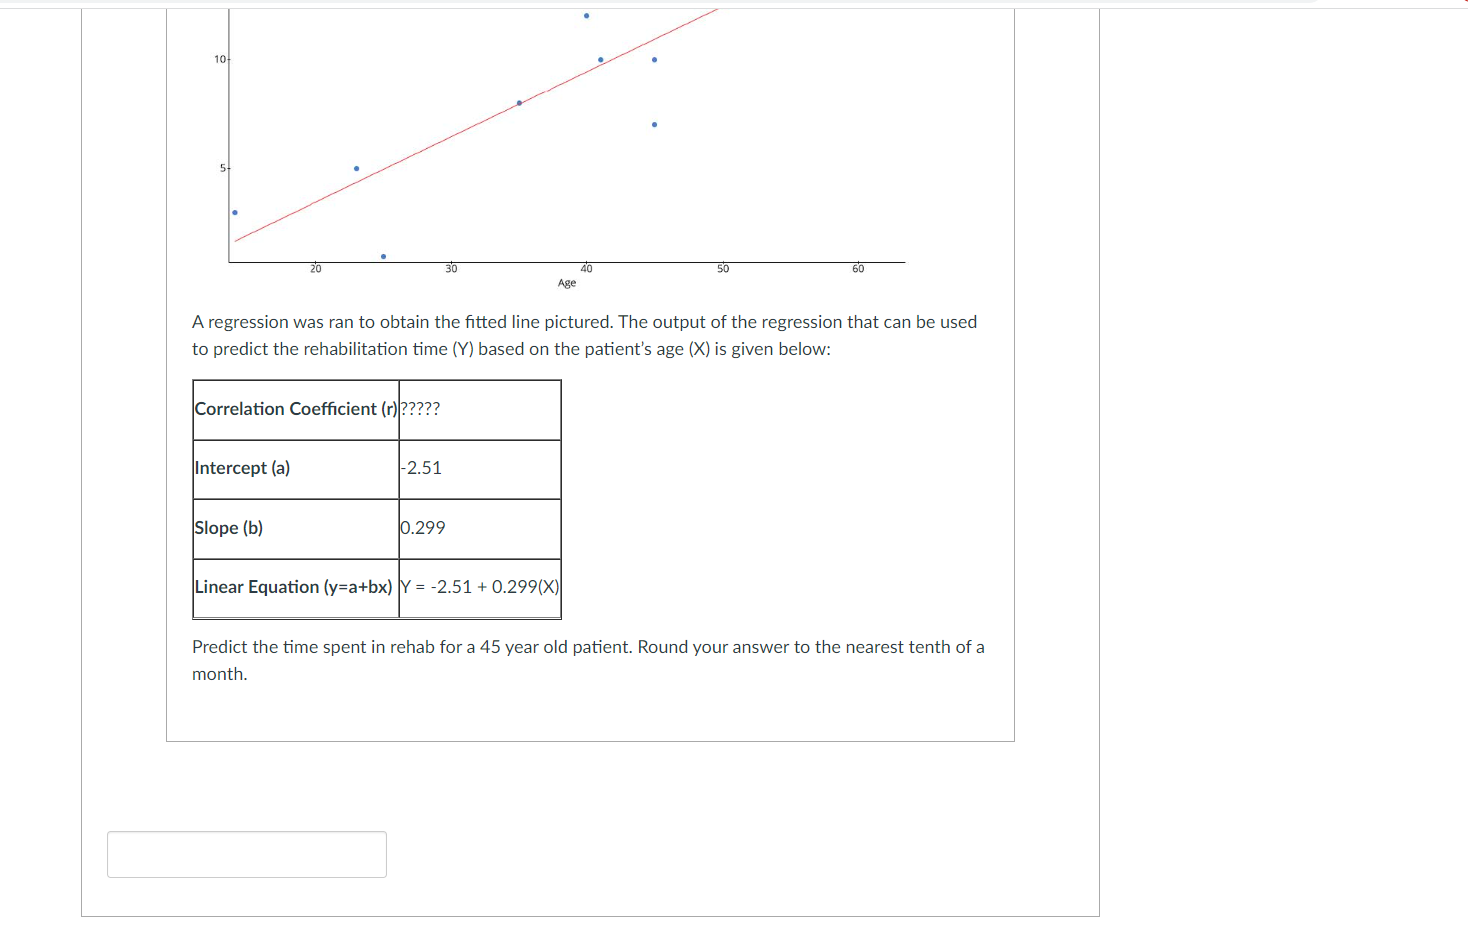
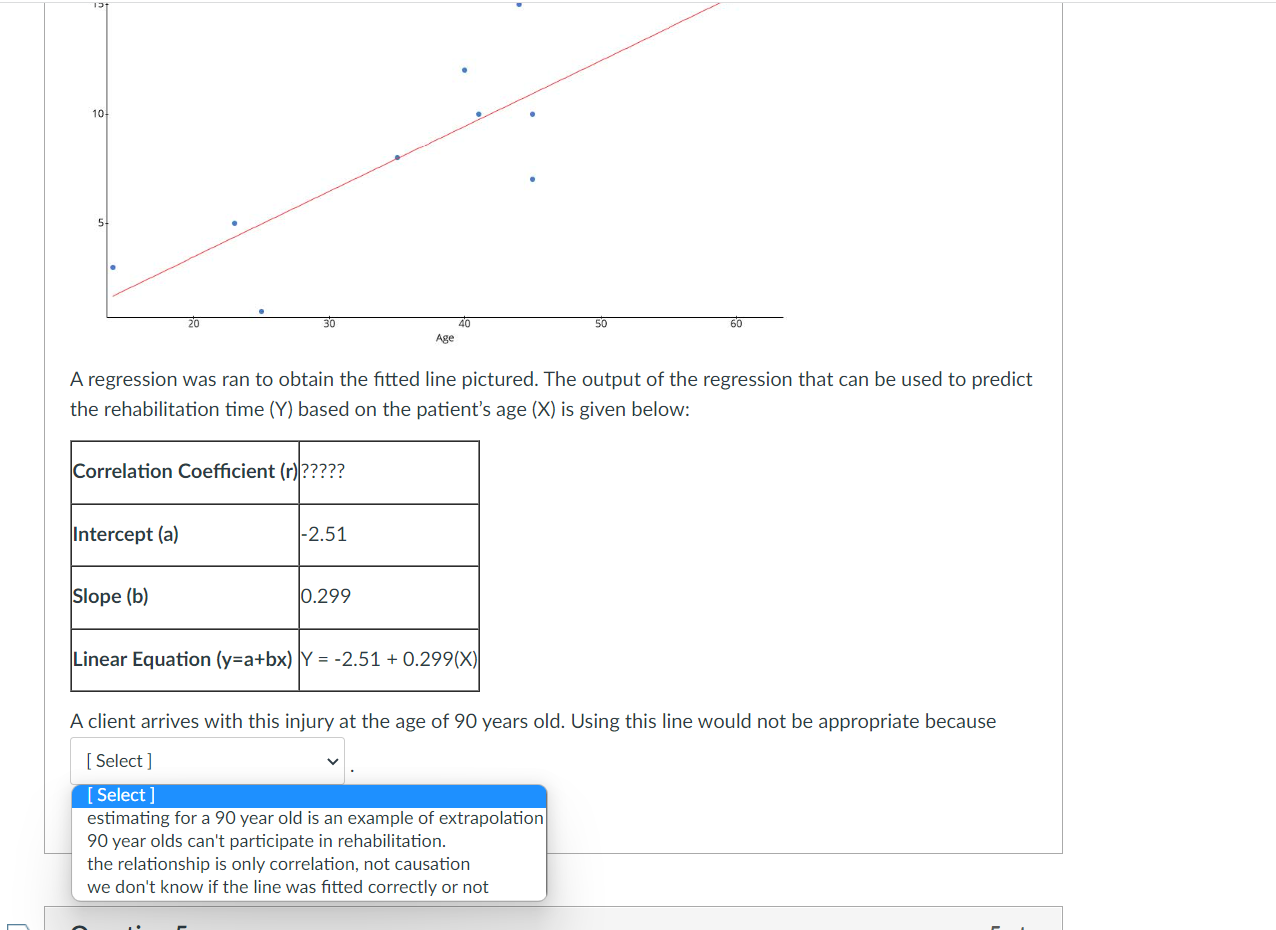
D Question 1 5 pts 4 Minutes, 23 Seconds The following scatterplot shows the relationship between the age (in years) of 10 randomly selected patients at a physical therapy clinic and how many months they spent in rehabilitation after surgery for a knee injury: - Fitted line Rehab 15 10 gs 51 20 30 50 60 Age A regression was ran to obtain the fitted line pictured. The output of the regression that can be used to predict the rehabilitation time (Y) based on the patient's age (X) is given below: Correlation Coefficient (r)????? Intercept (a) -2.51 Slope (b) 10.299 Linear Equation (y=a+bx) Y = -2.51 + 0.299(X)20 30 40 50 60 Age A regression was ran to obtain the fitted line pictured. The output of the regression that can be used to predict the rehabilitation time (Y) based on the patient's age (X) is given below: Correlation Coefficient (r) ????? Intercept (a) -2.51 Slope (b) 0.299 Linear Equation (y=a+bx) Y = -2.51 + 0.299(X) Which of the following is most likely the missing correlation coefficient? O 1.0 O 0.7 O 0.25 O -0.85. 30 40 50 60 Age A regression was ran to obtain the fitted line pictured. The output of the regression that can be used to predict the rehabilitation time (Y) based on the patient's age (X) is given below: Correlation Coefficient (r) ????? Intercept (a) -2.51 Slope (b) 10.299 Linear Equation (y=a+bx) Y = -2.51 + 0.299(X) Which of the following is the BEST interpretation of the slope? O For every 0.299 year increase in age, we expect a month increase in rehab time. O For every 2.51 year decrease in age, we expect a 0.299 month decrease in rehab time O For every year increase in age, we expect a 0.299 month increase in rehab time. O For every year increase in age, we expect a 2.51 month decrease in rehab time.10 5- 20 30 40 50 60 Age A regression was ran to obtain the fitted line pictured. The output of the regression that can be used to predict the rehabilitation time (Y) based on the patient's age (X) is given below: Correlation Coefficient (r) ????? Intercept (a) -2.51 Slope (b) 0.299 Linear Equation (y=a+bx) Y = -2.51 + 0.299(X) Predict the time spent in rehab for a 45 year old patient. Round your answer to the nearest tenth of a month.I: I0 20 an :10 50 ED m A regression was ran to obtain the tted line pictured. The output of the regression that can be used to predict the rehabilitation time (Y) based on the patient's age (X) is given below: A client arrives with this injury at the age of 90 years old. Using this line would not be appropriate because ' [Select] v _ [Select] estimating for a 90 year old is an example of extrapolation 90 year olds can't participate in rehabilitation. the relationship is only correlation, not causation we don't know if the line was tted correctly or not
Step by Step Solution
There are 3 Steps involved in it

Get step-by-step solutions from verified subject matter experts