

Question: D Question 10 1 pts Table shows a random sample of 200 cyclists and routes they prefer by gender. If you randomly select a person
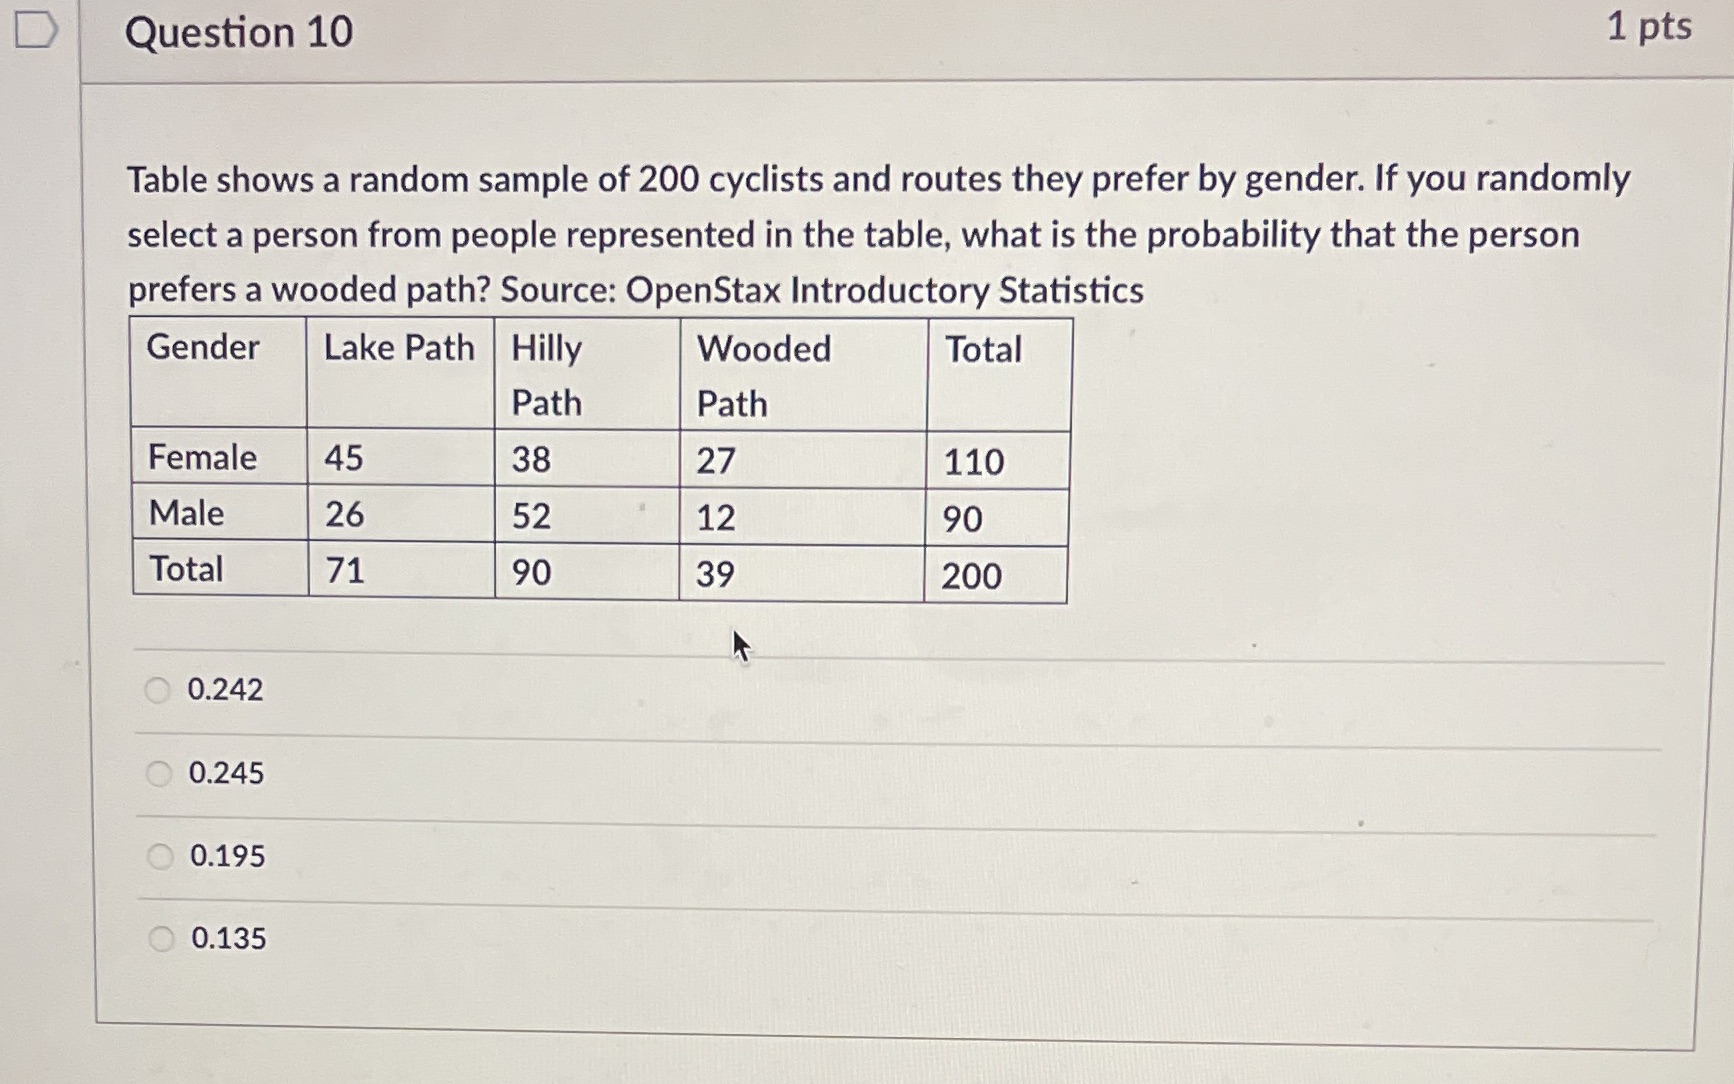
D Question 10 1 pts Table shows a random sample of 200 cyclists and routes they prefer by gender. If you randomly select a person from people represented in the table, what is the probability that the person prefers a wooded path? Source: OpenStax Introductory Statistics Gender Lake Path Hilly Wooded Total Path Path Female 45 38 27 110 Male 26 52 12 90 Total 71 90 39 200 O 0.242 0.245 0.195 0.135
Step by Step Solution
There are 3 Steps involved in it
1 Expert Approved Answer
Step: 1 Unlock

Question Has Been Solved by an Expert!
Get step-by-step solutions from verified subject matter experts
Step: 2 Unlock
Step: 3 Unlock