

Question: D Question 12 3 pts The following table illustrates the production capabilities of Ohio and Michigan. The two states each have the ability to make
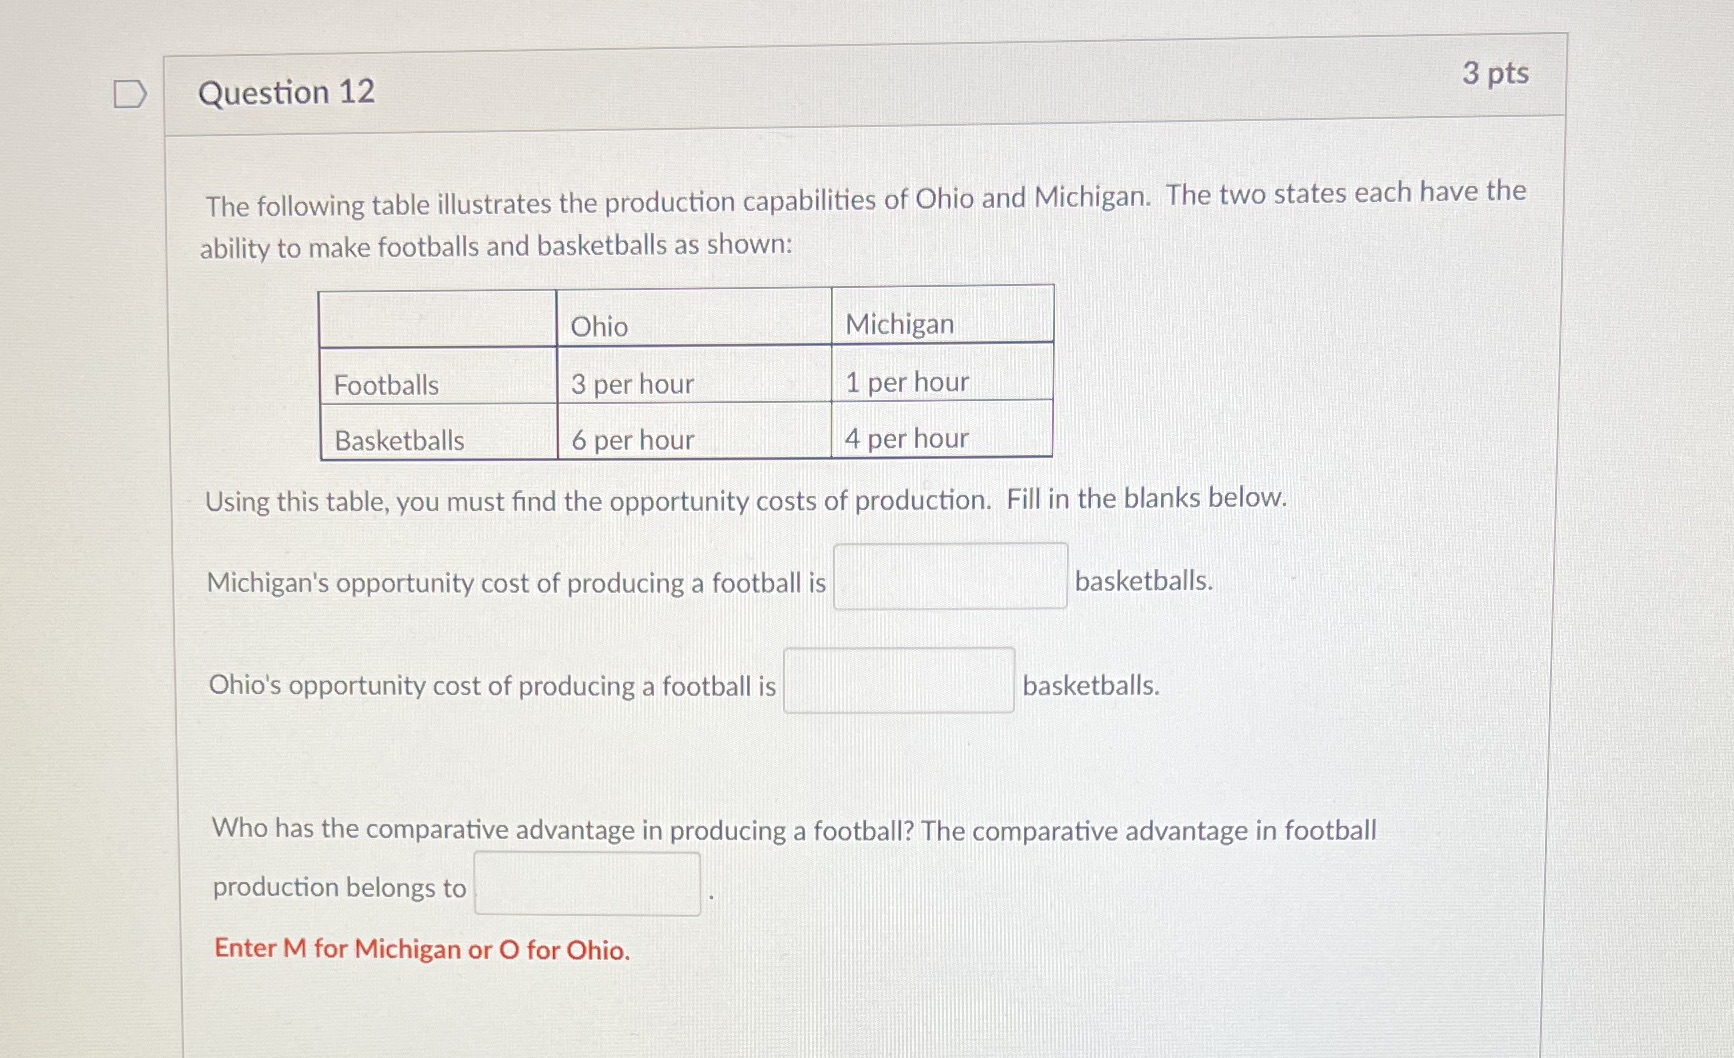
D Question 12 3 pts The following table illustrates the production capabilities of Ohio and Michigan. The two states each have the ability to make footballs and basketballs as shown: Ohio Michigan Footballs 3 per hour 1 per hour Basketballs 6 per hour 4 per hour Using this table, you must find the opportunity costs of production. Fill in the blanks below. Michigan's opportunity cost of producing a football is basketballs. Ohio's opportunity cost of producing a football is basketballs. Who has the comparative advantage in producing a football? The comparative advantage in football production belongs to Enter M for Michigan or O for Ohio
Step by Step Solution
There are 3 Steps involved in it

Get step-by-step solutions from verified subject matter experts