

Question: D Question 12 66 pts A math instructor is interested in analyzing the most recent exam scores in her calculus class. She records the 21
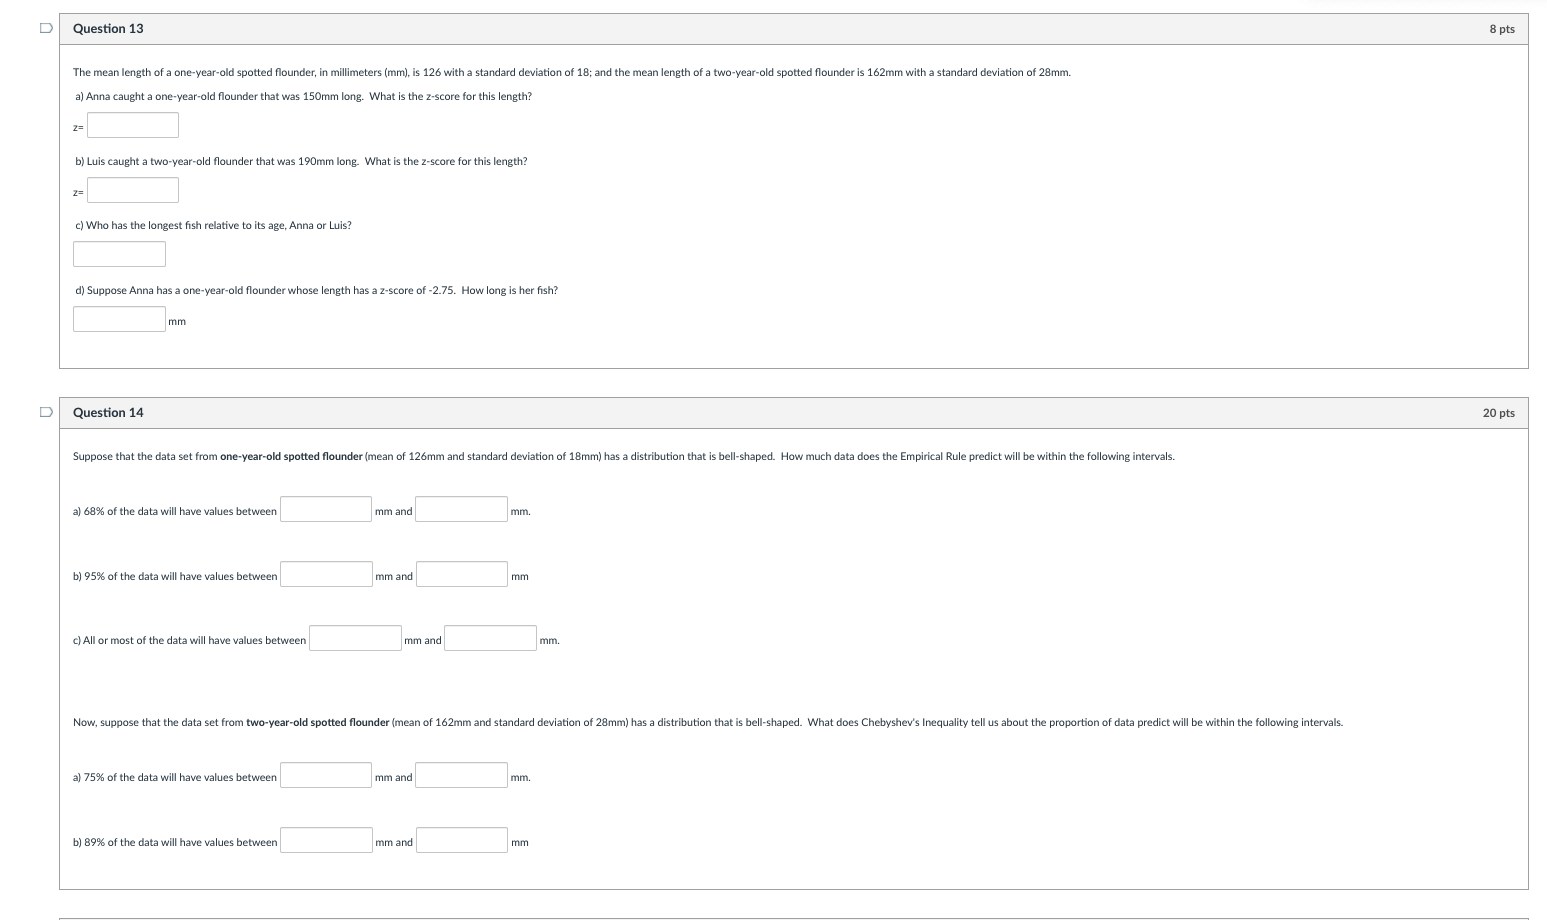
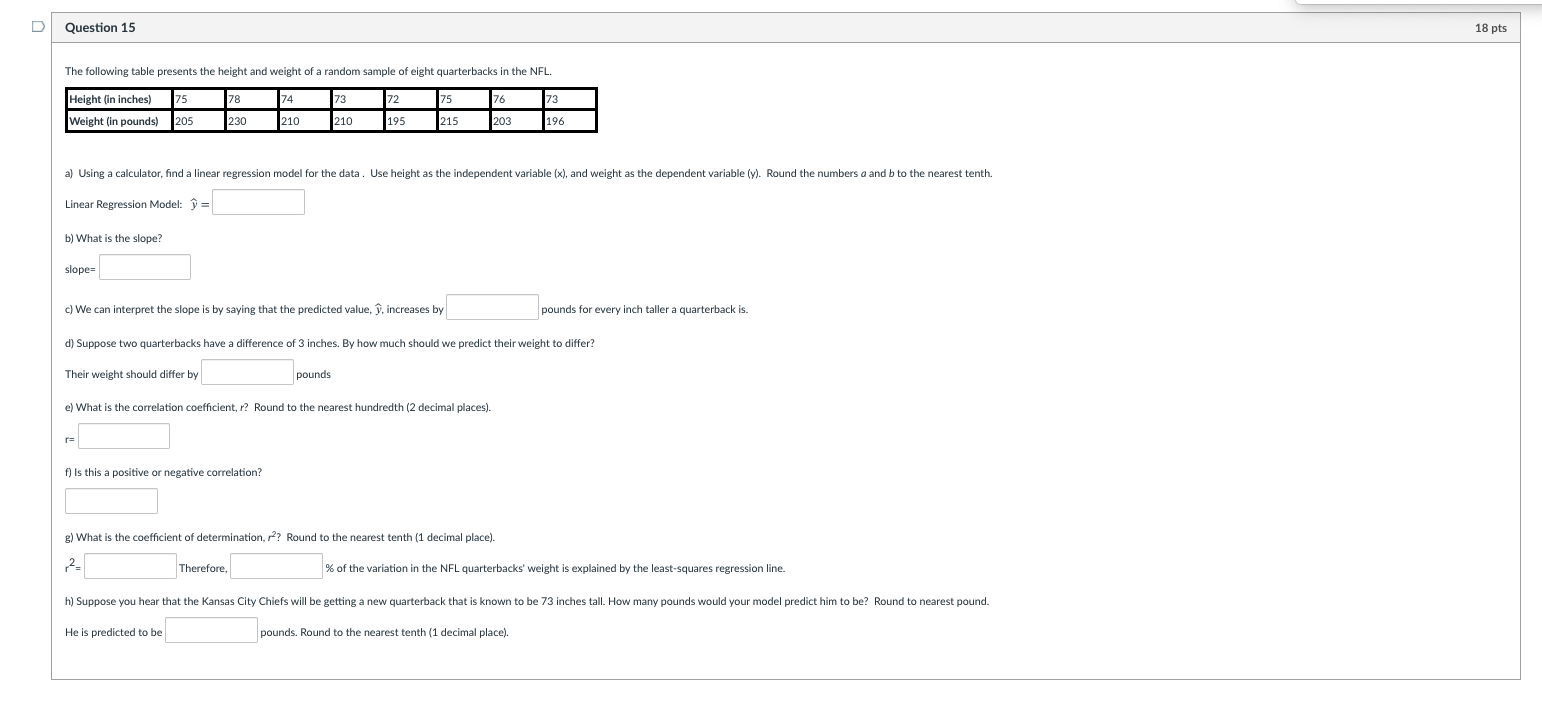
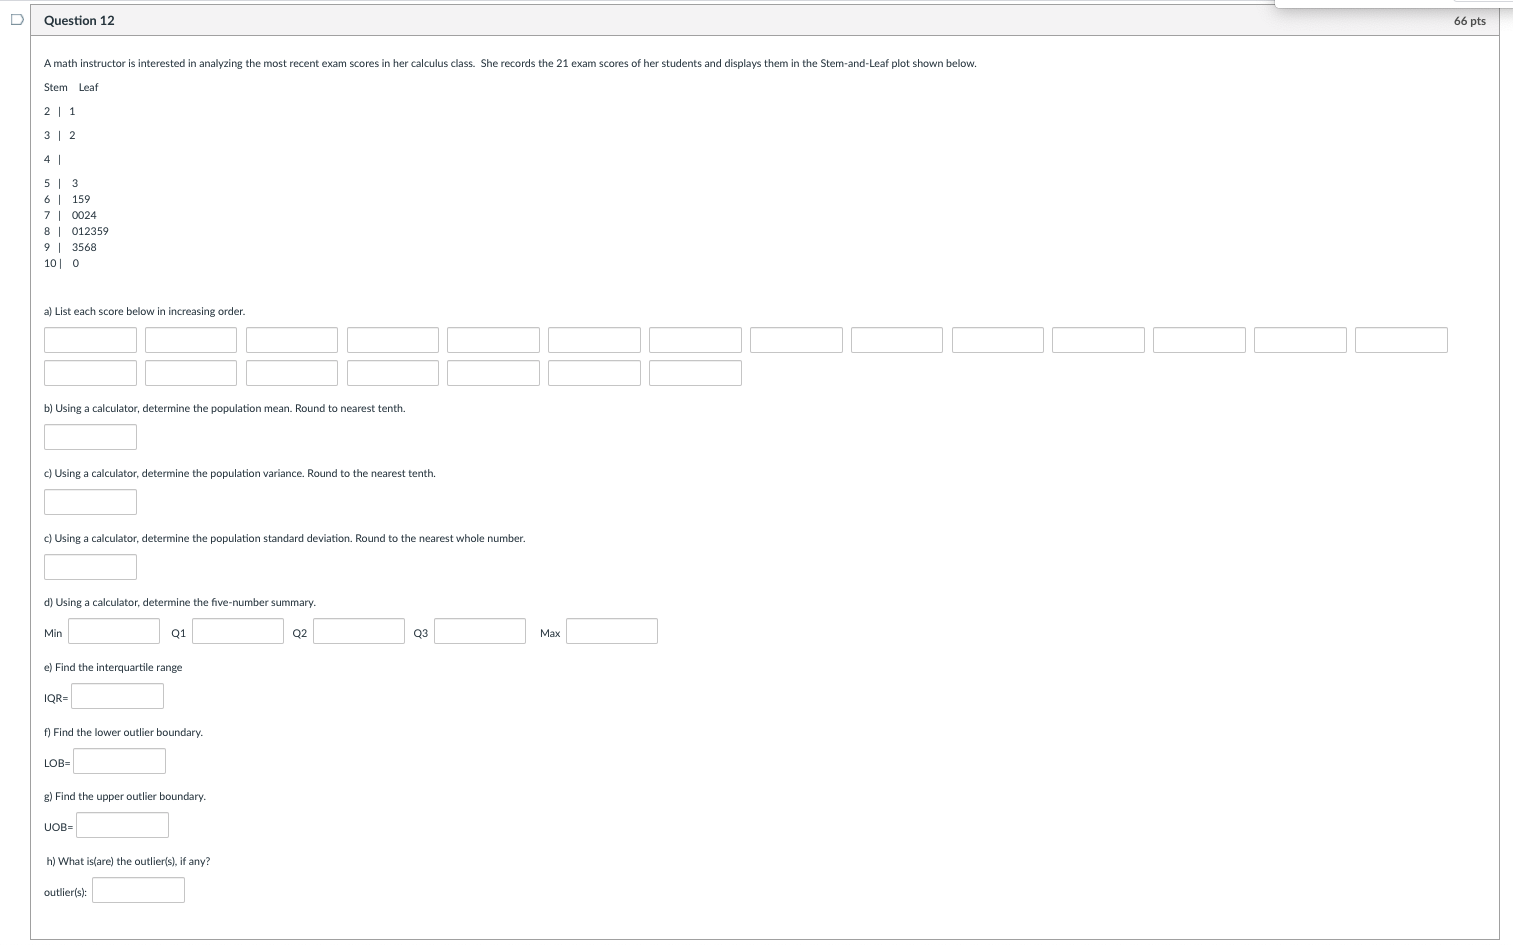


D Question 12 66 pts A math instructor is interested in analyzing the most recent exam scores in her calculus class. She records the 21 exam scores of her students and displays them in the Stem-and-Leaf plot shown below. Stem Leaf 2 1 3 | 2 4 5 3 6 159 7 1 0024 8 1 012359 9 | 3568 10 | 0 a) List each score below in increasing order. b) Using a calculator, determine the population mean. Round to nearest tenth. c) Using a calculator, determine the population variance. Round to the nearest tenth. c) Using a calculator, determine the population standard deviation. Round to the nearest whole number. d) Using a calculator, determine the five-number summary. Min Q1 Q2 Q3 Max e) Find the interquartile range IQR= f) Find the lower outlier boundary. LOB= g) Find the upper outlier boundary. UOB= h) What is(are) the outlier(s), if any? outlier(s):D Question 13 8 pts The mean length of a one-year-old spotted flounder, in millimeters (mm), is 126 with a standard deviation of 18; and the mean length of a two-year-old spotted flounder is 162mm with a standard deviation of 28mm. a) Anna caught a one-year-old flounder that was 150mm long. What is the z-score for this length? b) Luis caught a two-year-old flounder that was 190mm long. What is the z-score for this length? 2= c) Who has the longest fish relative to its age, Anna or Luis? d) Suppose Anna has a one-year-old flounder whose length has a z-score of -2.75. How long is her fish? mm D Question 14 20 pts Suppose that the data set from one-year-old spotted flounder (mean of 126mm and standard deviation of 18mm) has a distribution that is bell-shaped. How much data does the Empirical Rule predict will be within the following intervals. a) 68% of the data will have values between mm and mm. b) 95% of the data will have values between mm and mm c) All or most of the data will have values between mm and mm. Now, suppose that the data set from two-year-old spotted flounder (mean of 162mm and standard deviation of 28mm) has a distribution that is bell-shaped. What does Chebyshev's Inequality tell us about the proportion of data predict will be within the following intervals. a) 75% of the data will have values between mm and mm. b) 89% of the data will have values between mm and mmD Question 15 18 pts The following table presents the height and weight of a random sample of eight quarterbacks in the NFL. Height (in inches) 75 78 74 73 72 75 76 73 Weight (in pounds) 205 230 210 210 195 215 203 196 a) Using a calculator, find a linear regression model for the data . Use height as the independent variable (x), and weight as the dependent variable (y). Round the numbers a and b to the nearest tenth. Linear Regression Model: = b) What is the slope? slope= c) We can interpret the slope is by saying that the predicted value, y, increases by pounds for every inch taller a quarterback is. d) Suppose two quarterbacks have a difference of 3 inches. By how much should we predict their weight to differ? Their weight should differ by pounds e) What is the correlation coefficient, r? Round to the nearest hundredth (2 decimal places). f) Is this a positive or negative correlation? g) What is the coefficient of determination, /?? Round to the nearest tenth (1 decimal place). Therefore, % of the variation in the NFL quarterbacks' weight is explained by the least-squares regression line. h) Suppose you hear that the Kansas City Chiefs will be getting a new quarterback that is known to be 73 inches tall. How many pounds would your model predict him to be? Round to nearest pound. He is predicted to be pounds. Round to the nearest tenth (1 decimal place)
Step by Step Solution
There are 3 Steps involved in it

Get step-by-step solutions from verified subject matter experts