

Question: D Question 2 20 pts State the appropriate graphic or statistical procedure for each procedure. To investigate how weight loss changes according to activity levels
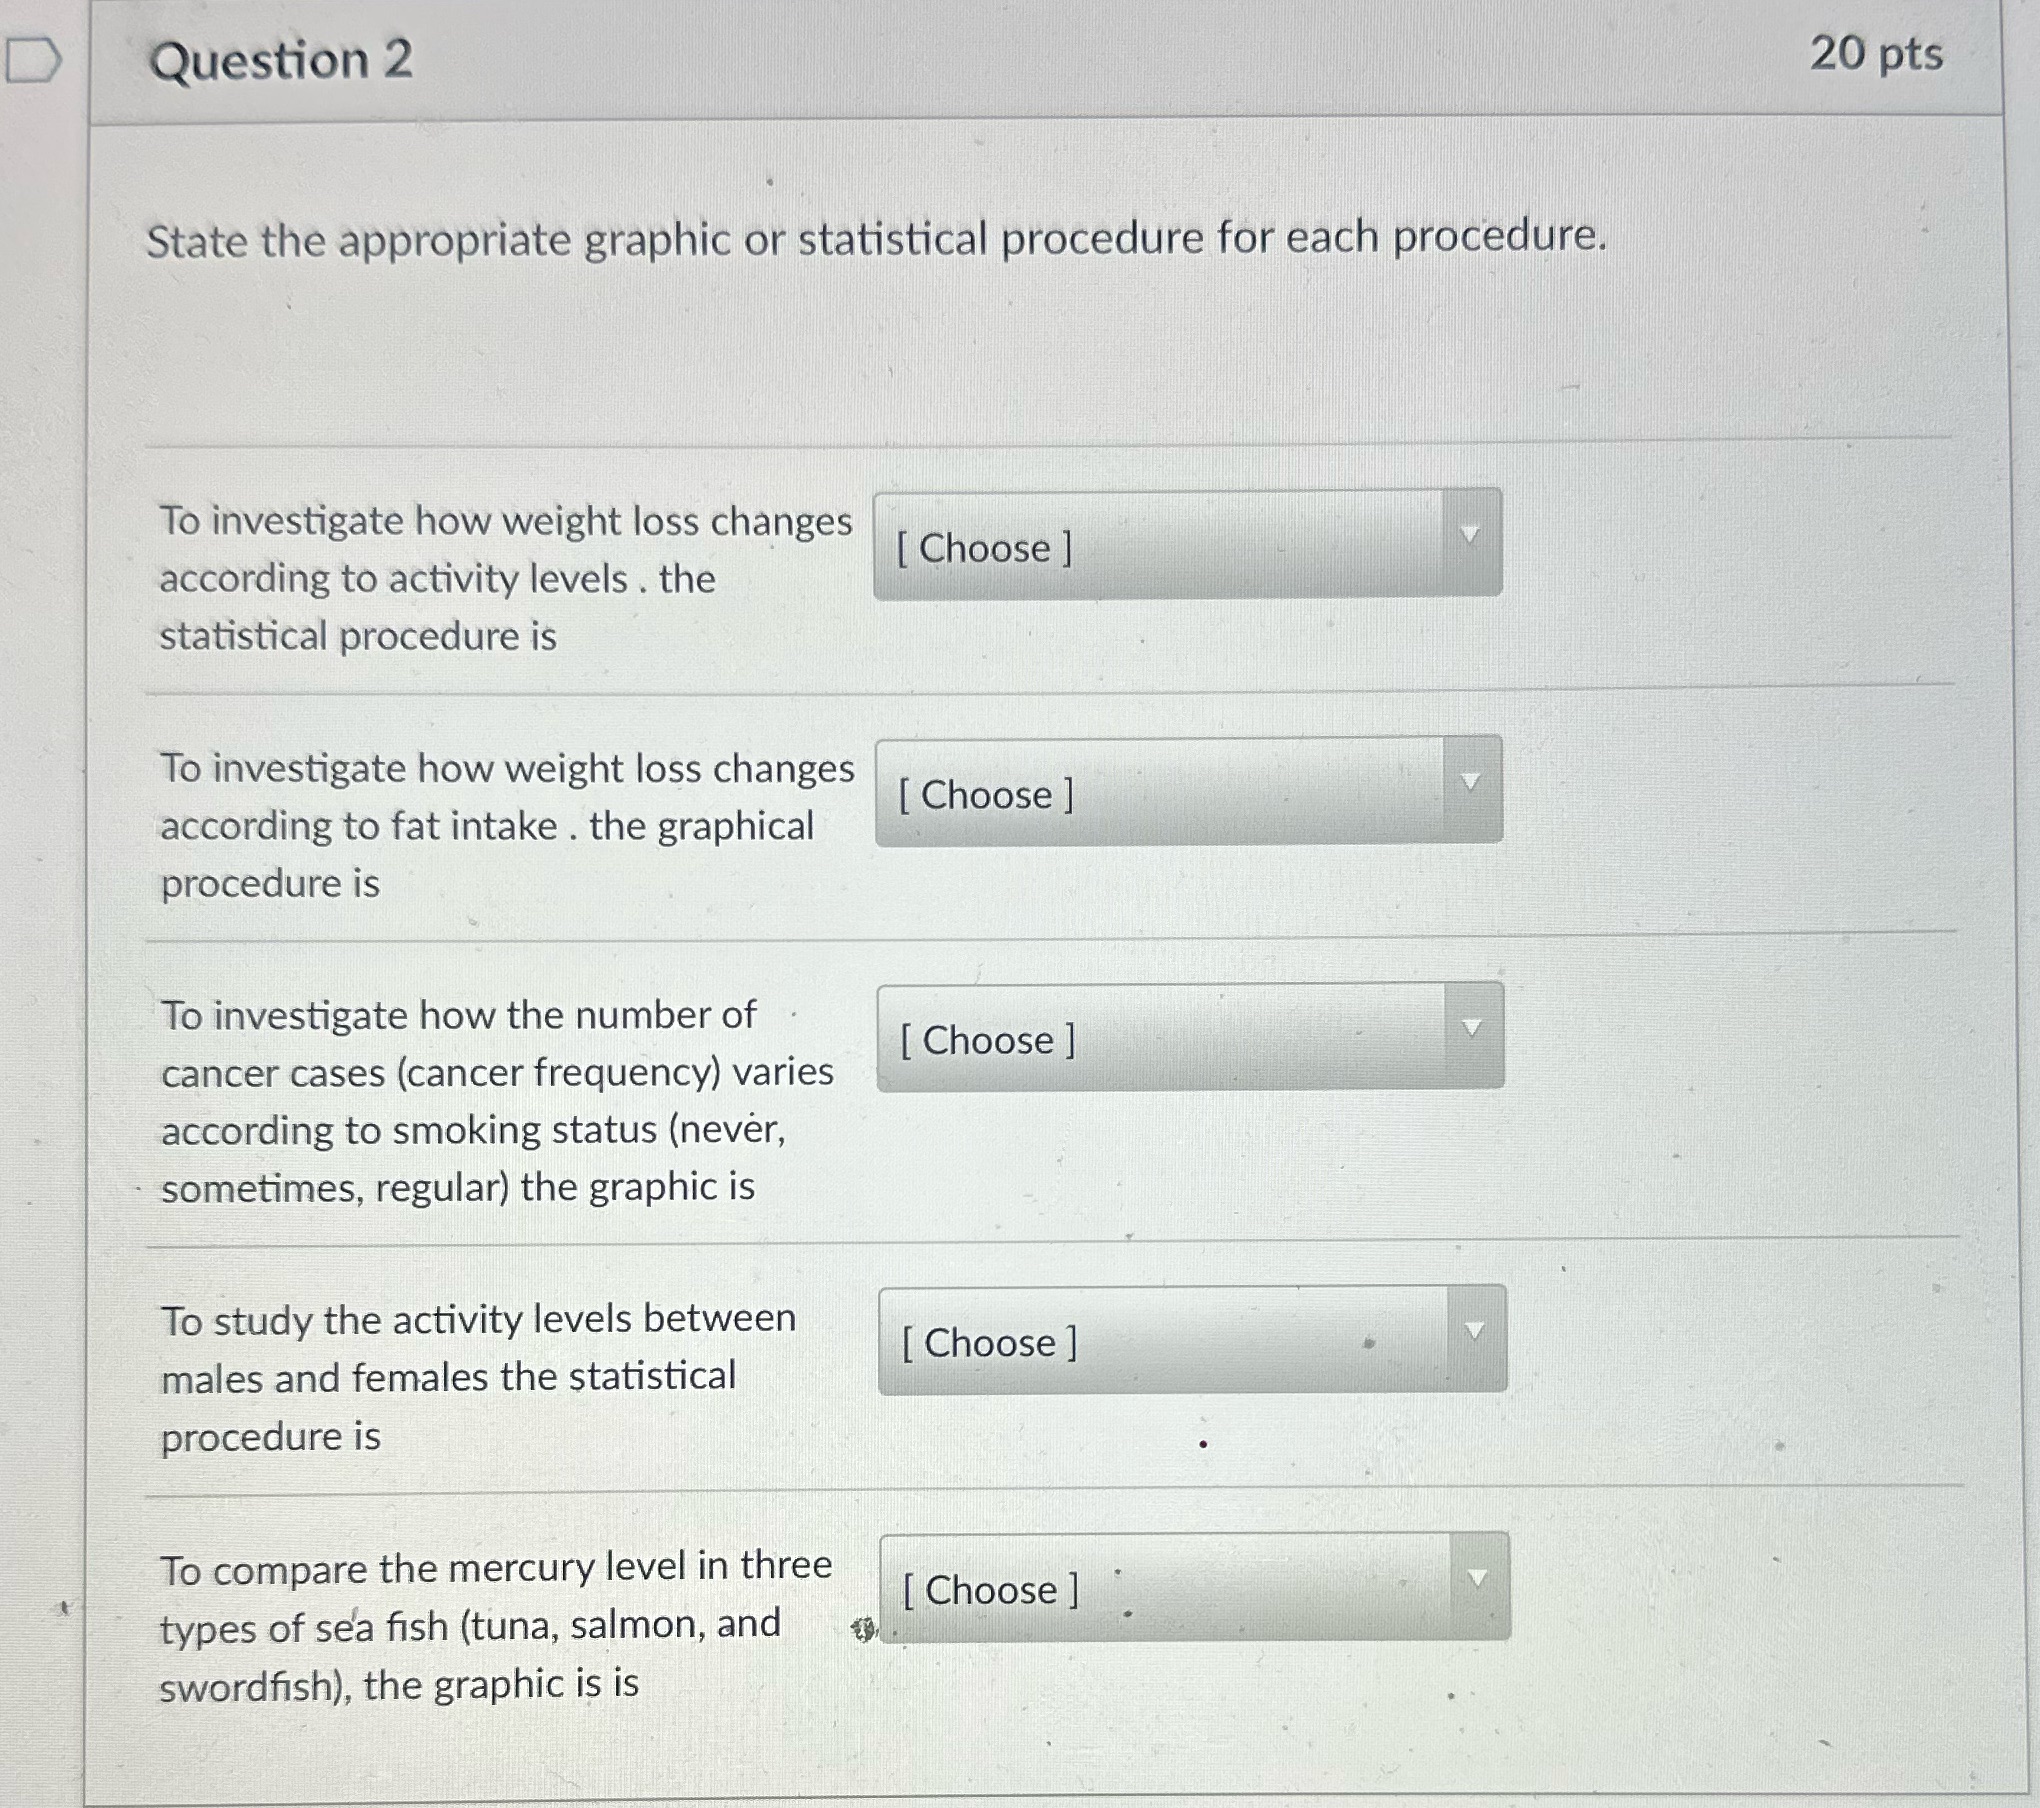
D Question 2 20 pts State the appropriate graphic or statistical procedure for each procedure. To investigate how weight loss changes according to activity levels . the [ Choose ] statistical procedure is To investigate how weight loss changes [ Choose ] according to fat intake . the graphical procedure is To investigate how the number of [ Choose ] cancer cases (cancer frequency) varies according to smoking status (never, sometimes, regular) the graphic is To study the activity levels between [ Choose ] males and females the statistical procedure is To compare the mercury level in three [ Choose ] types of sea fish (tuna, salmon, and swordfish), the graphic is is
Step by Step Solution
There are 3 Steps involved in it

Get step-by-step solutions from verified subject matter experts