

Question: D Question 2 Consider the following two regression lines for Stock A (left) and B (right) in the following figure. TA-Tf O True TM-T O
D Question 2 Consider the following two regression lines for Stock A (left) and B (right) in the following figure. TA-Tf O True TM-T O False 20 pts TB-f Stock A has higher systematic risk than that of Stock B. TM-f
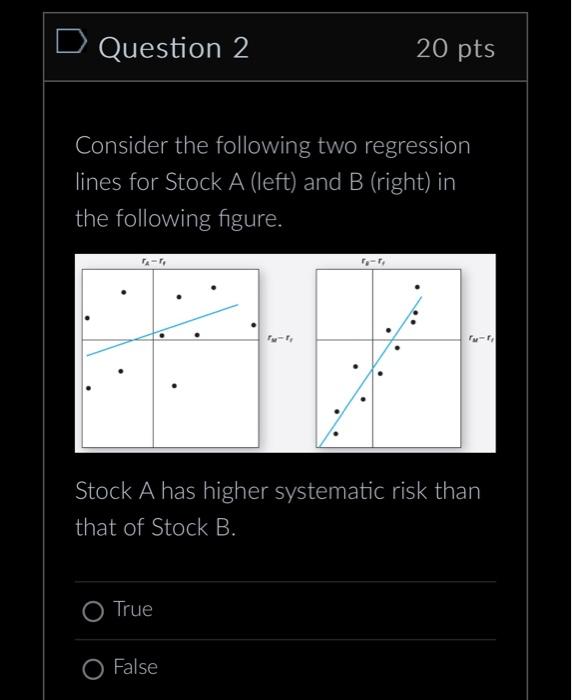
Consider the following two regression lines for Stock A (left) and B (right) in the following figure. Stock A has higher systematic risk than that of Stock B. True False
Step by Step Solution
There are 3 Steps involved in it
1 Expert Approved Answer
Step: 1 Unlock

Question Has Been Solved by an Expert!
Get step-by-step solutions from verified subject matter experts
Step: 2 Unlock
Step: 3 Unlock