

Question: D Question 2 Which line best fits the data shown in the scatter plot? 8 fy 4 - 2. -8 -4 -2 2 4 6
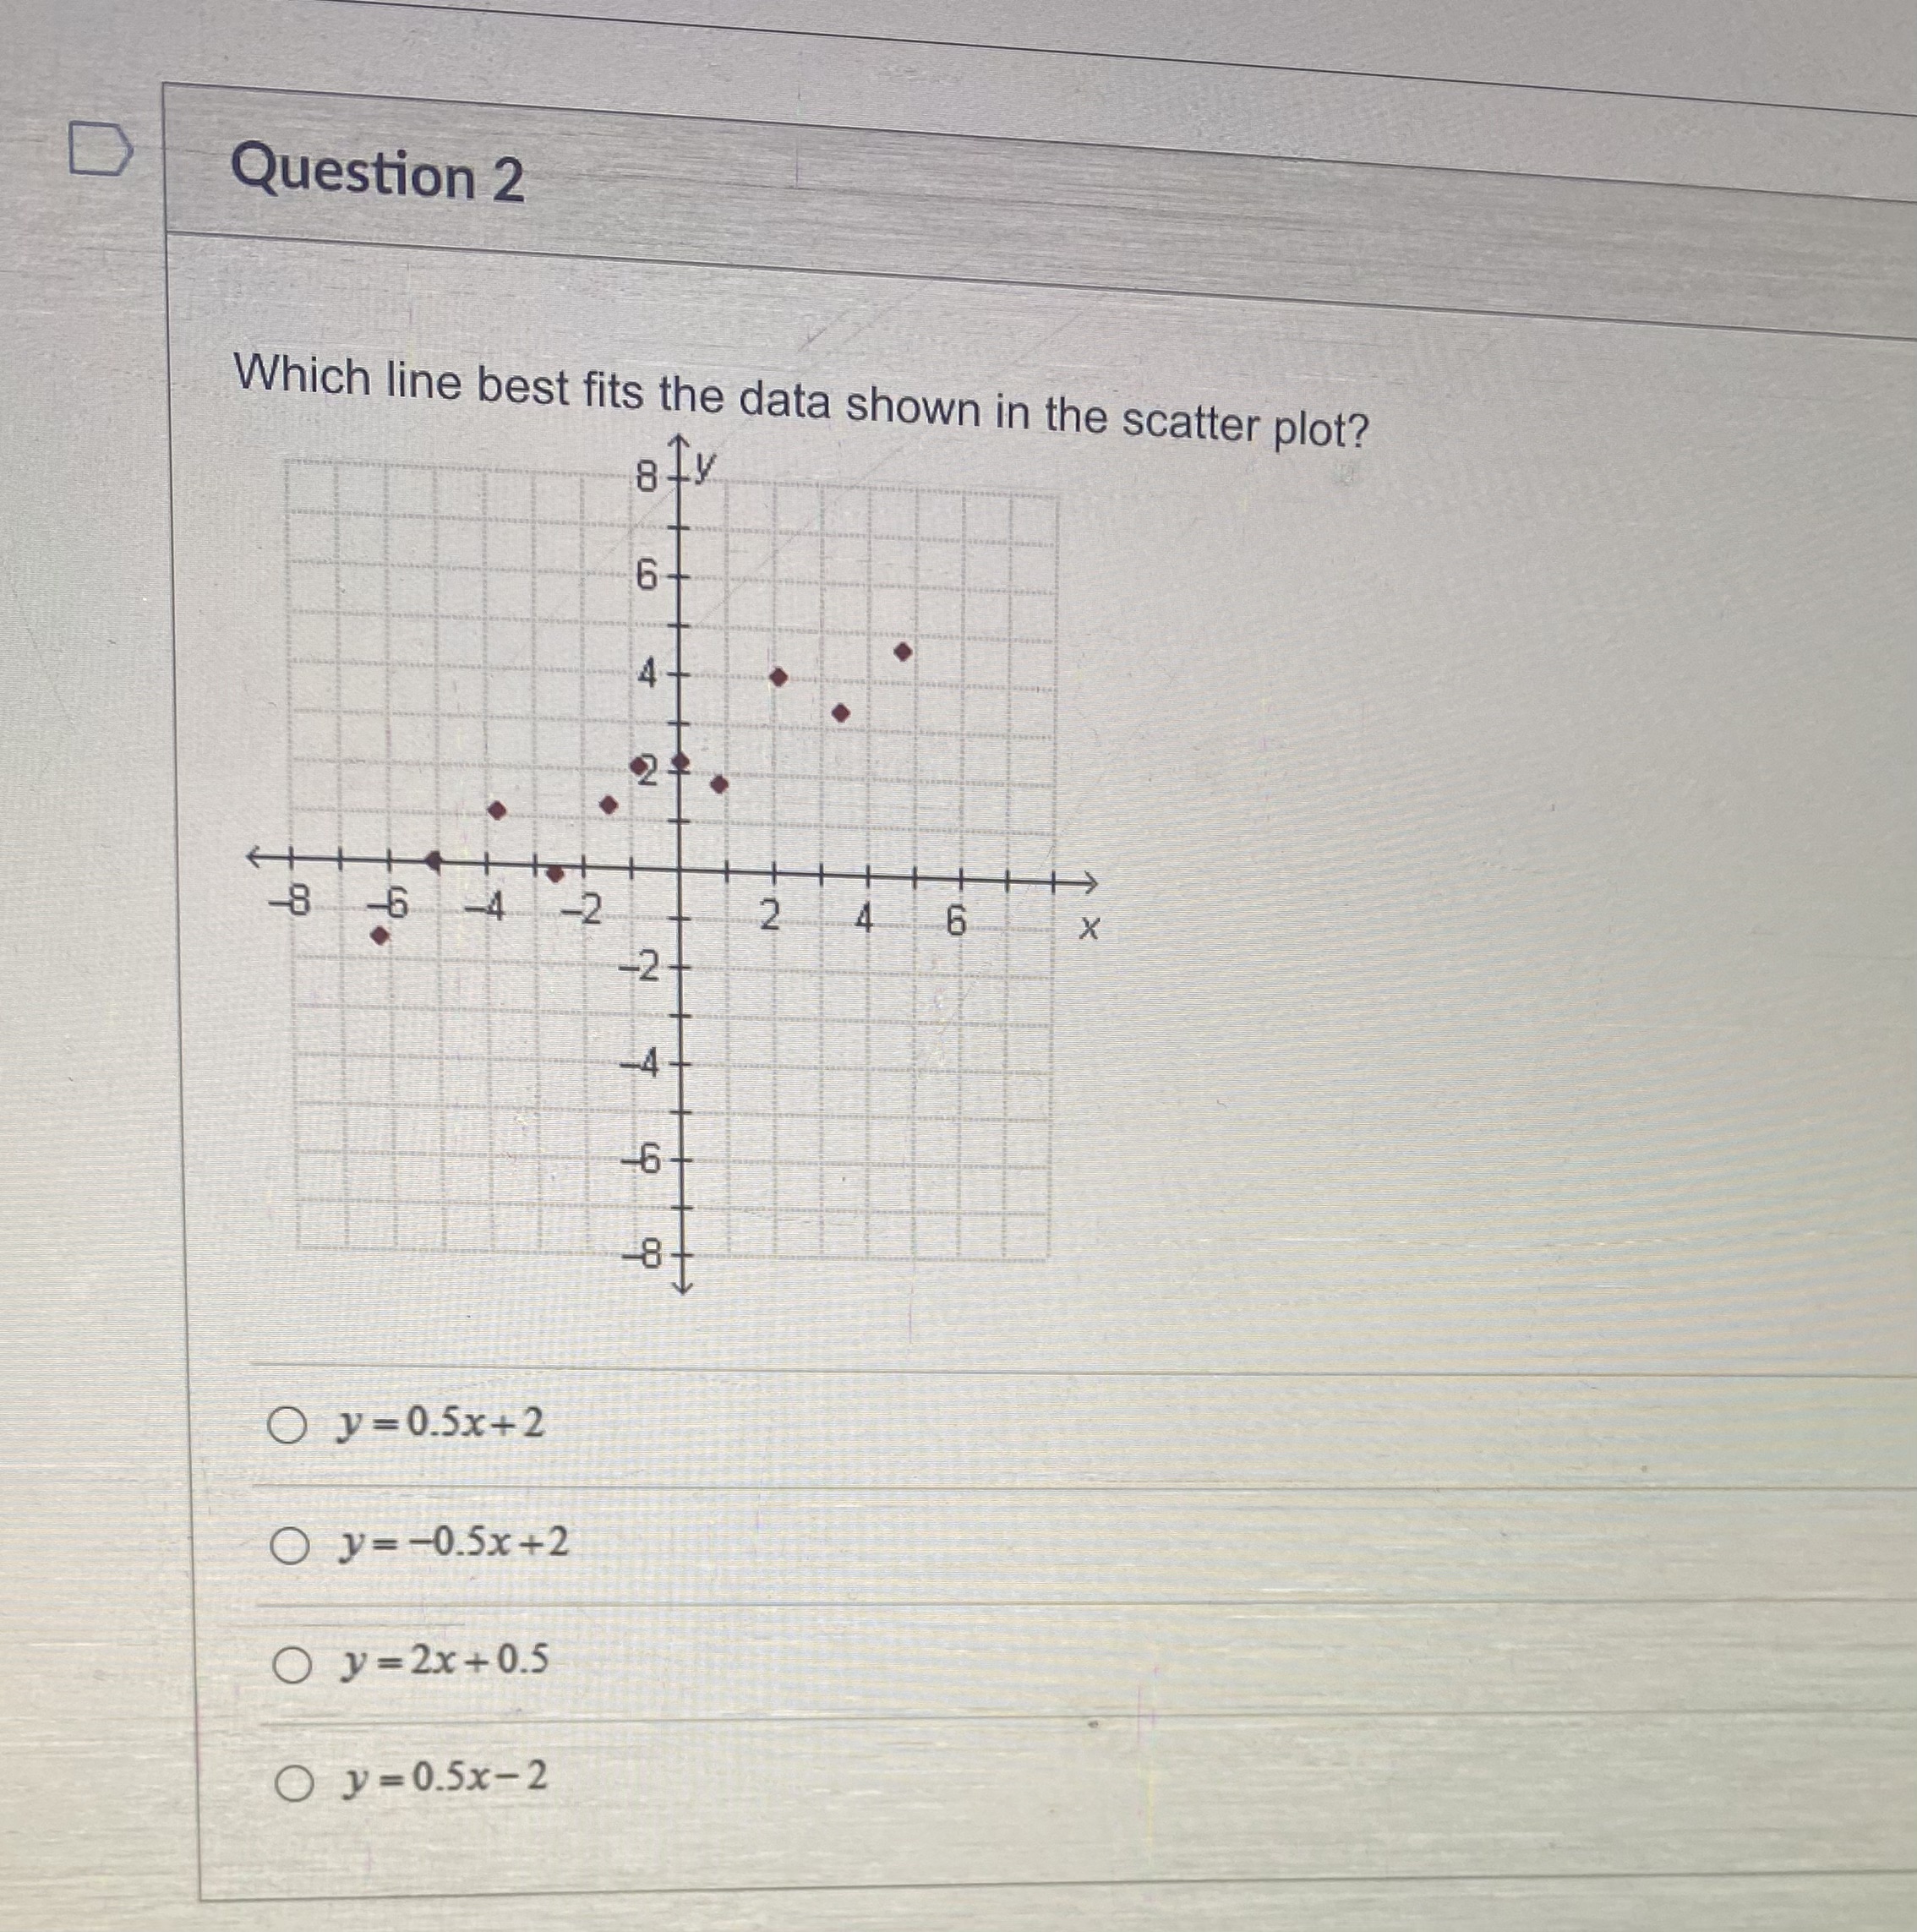
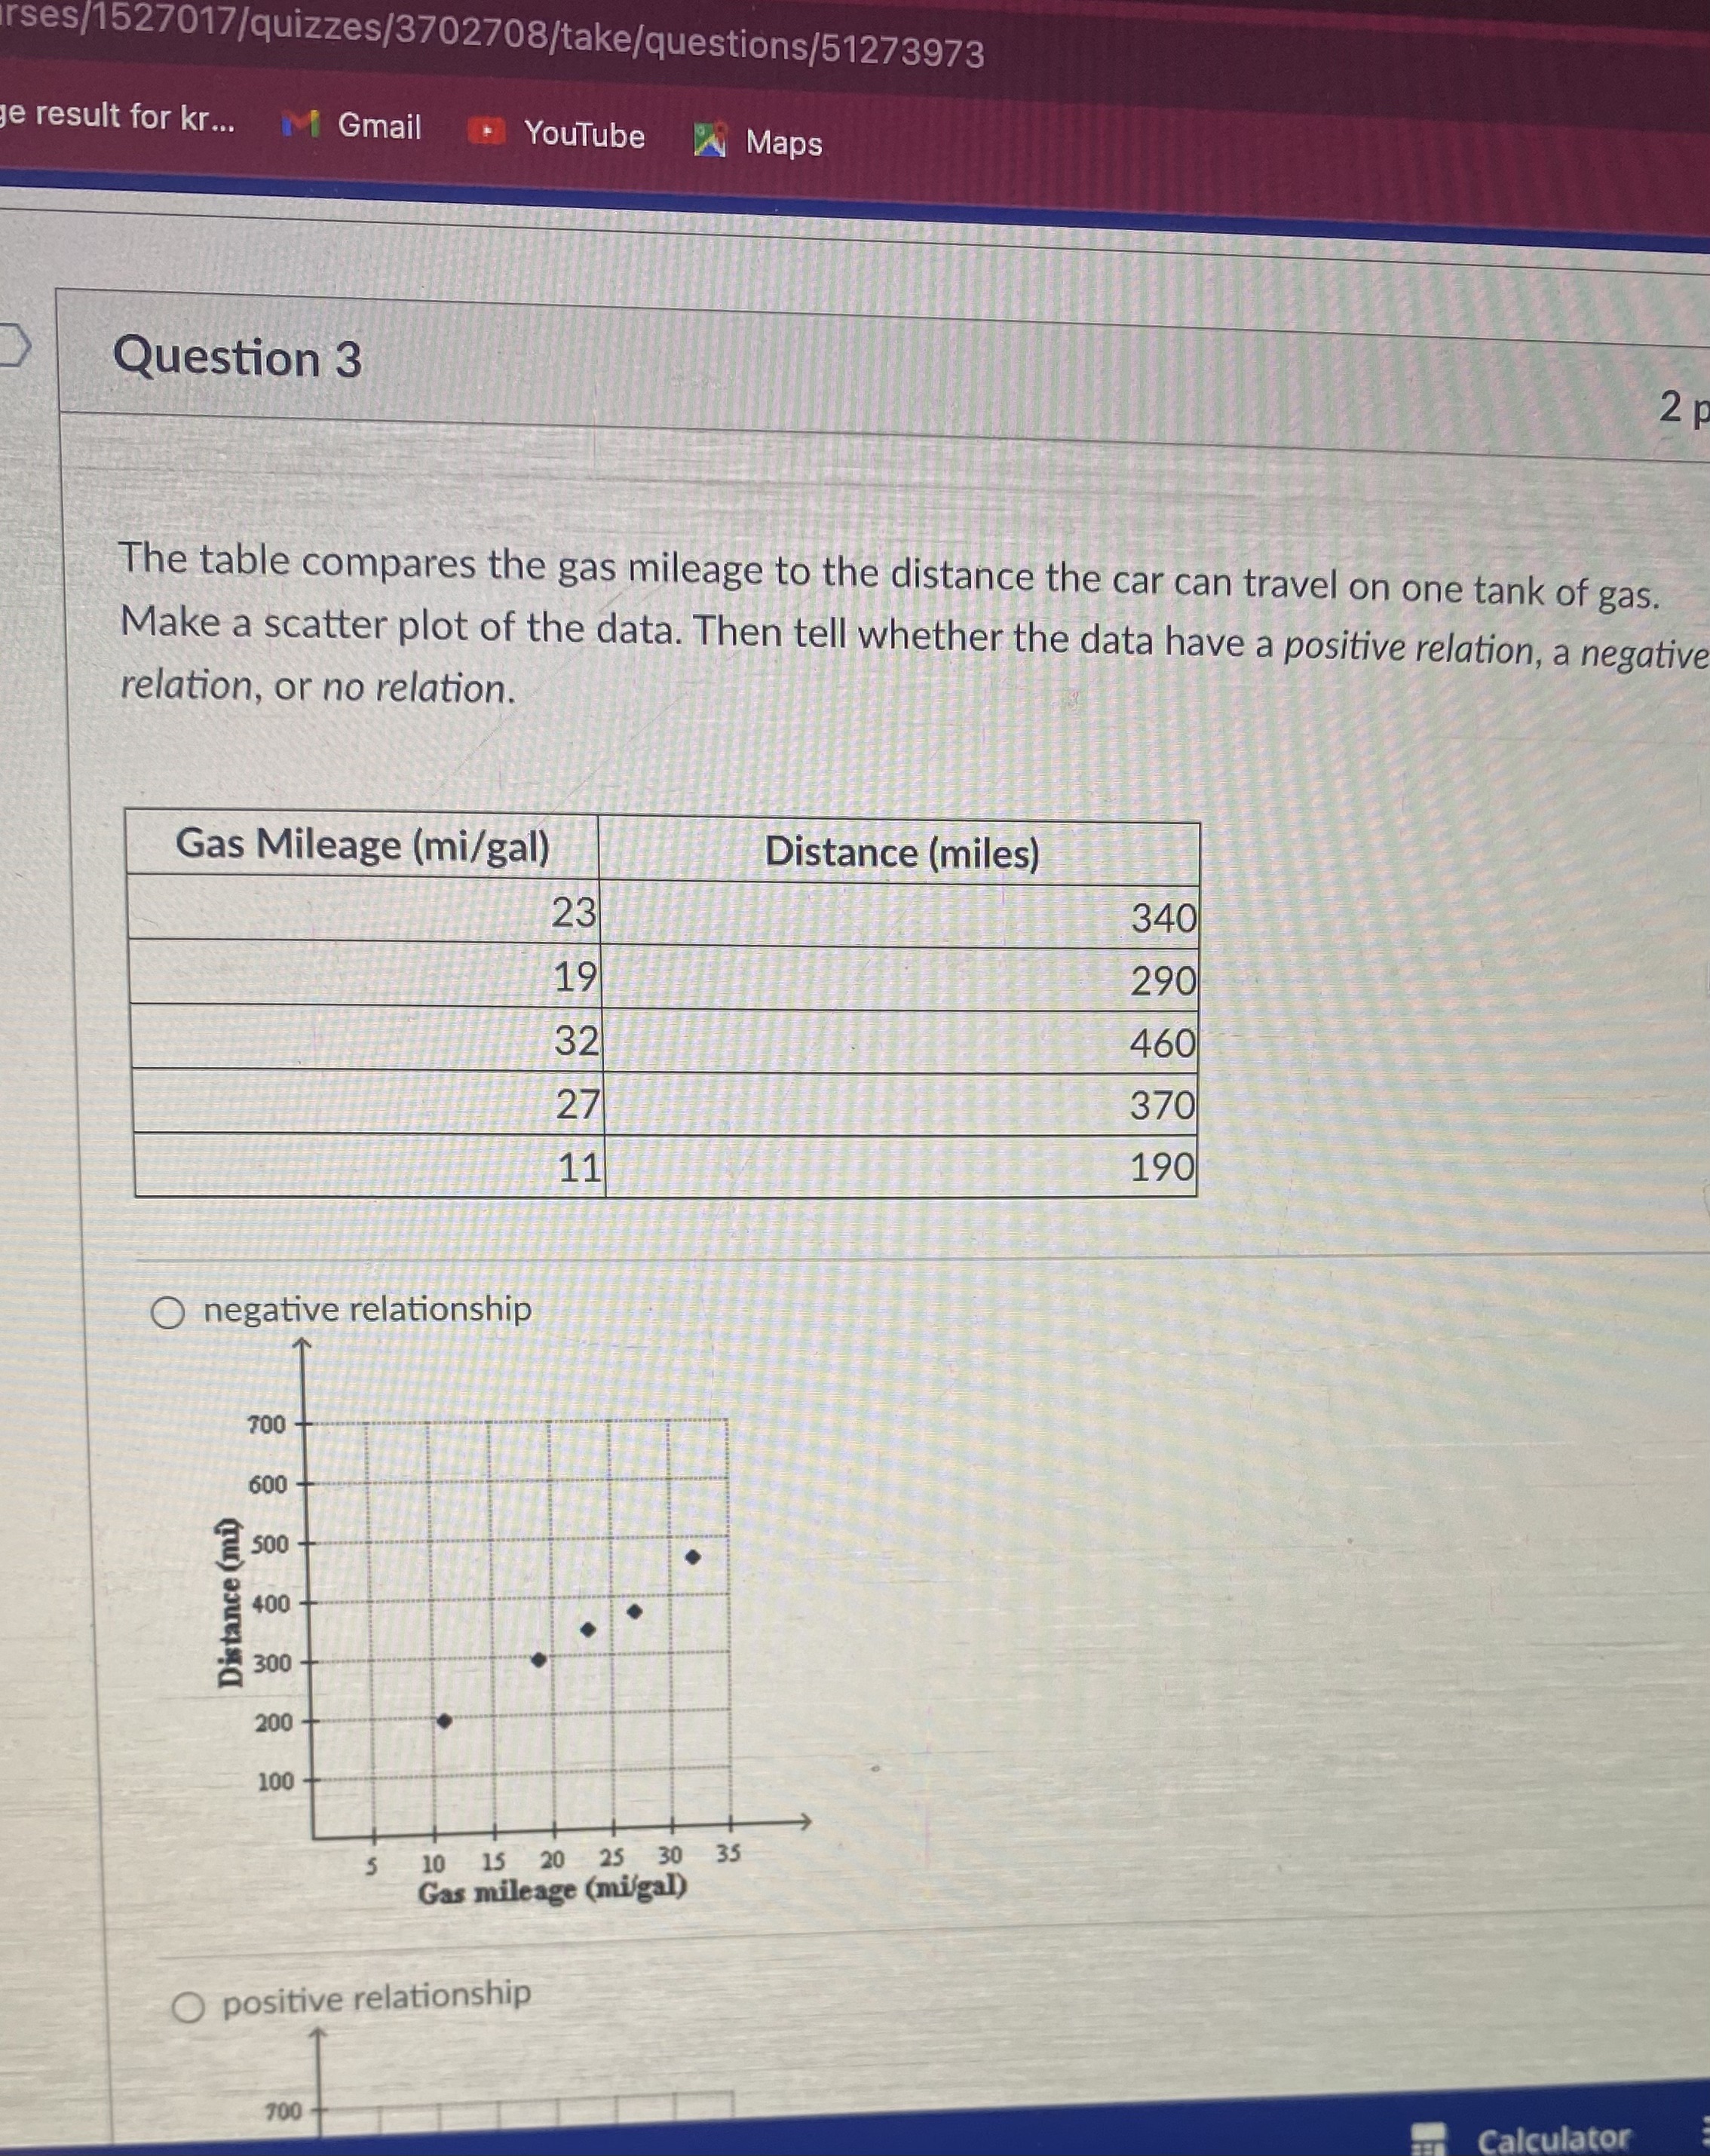
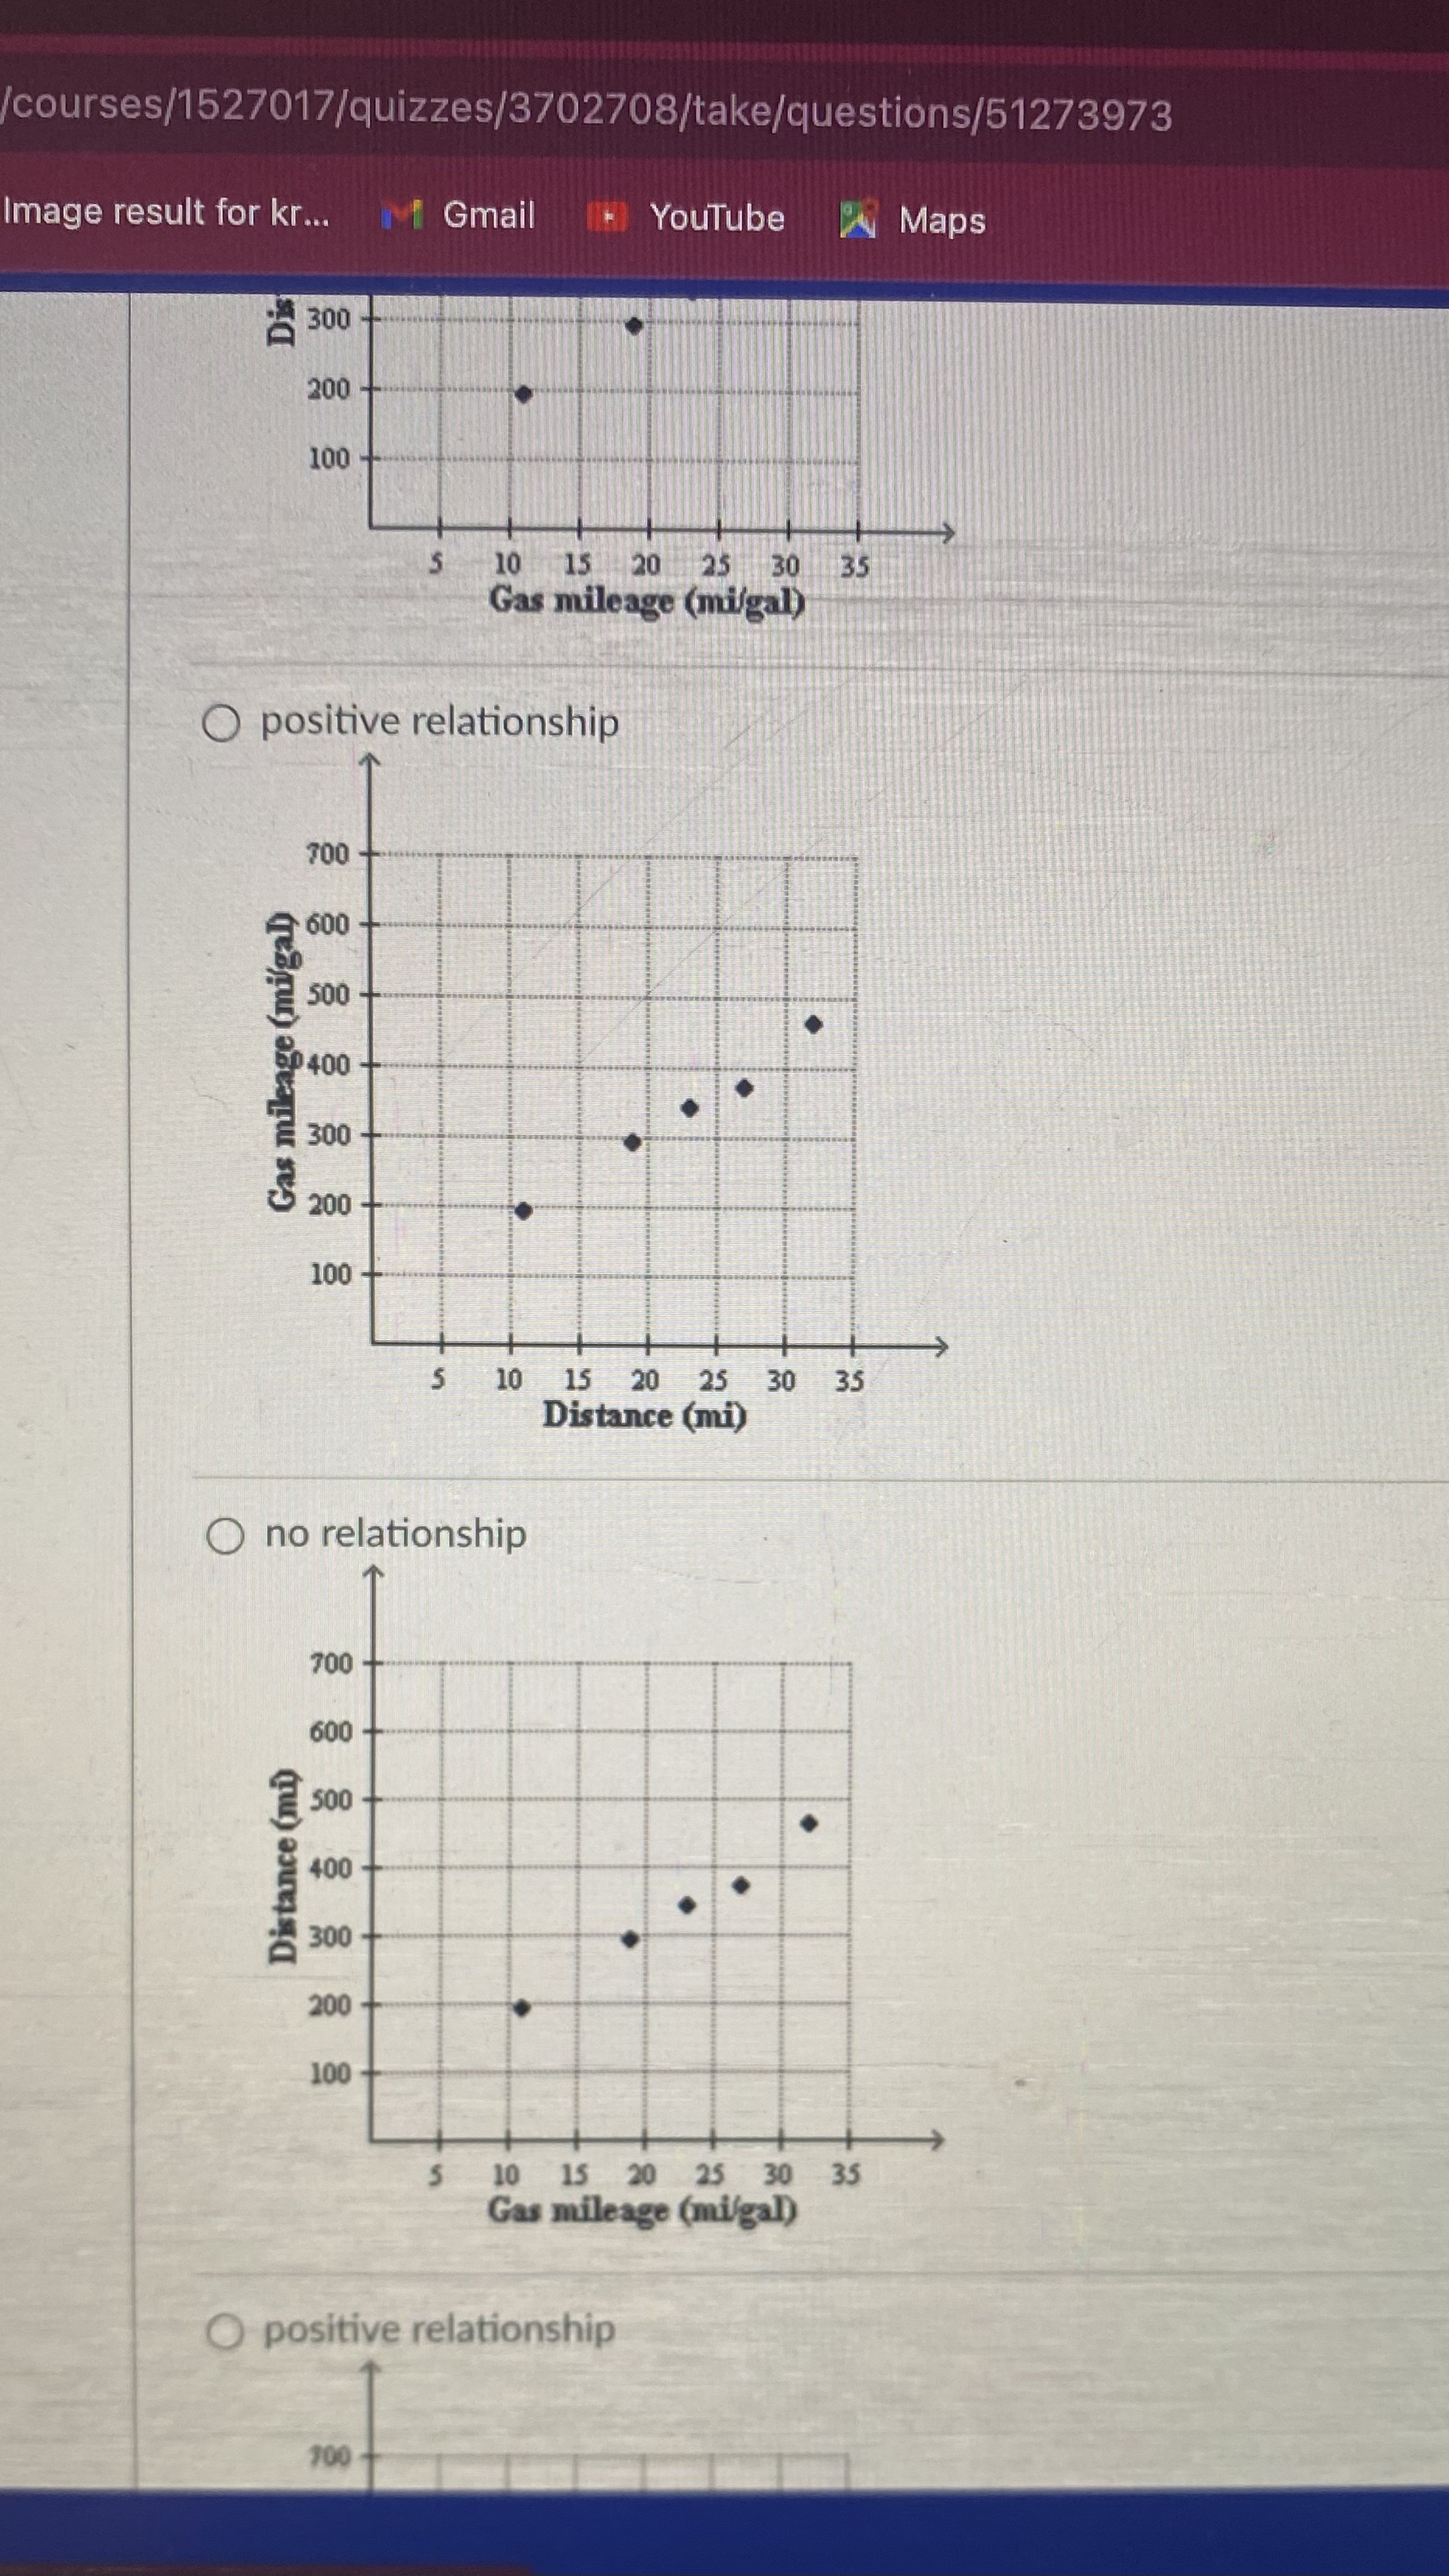
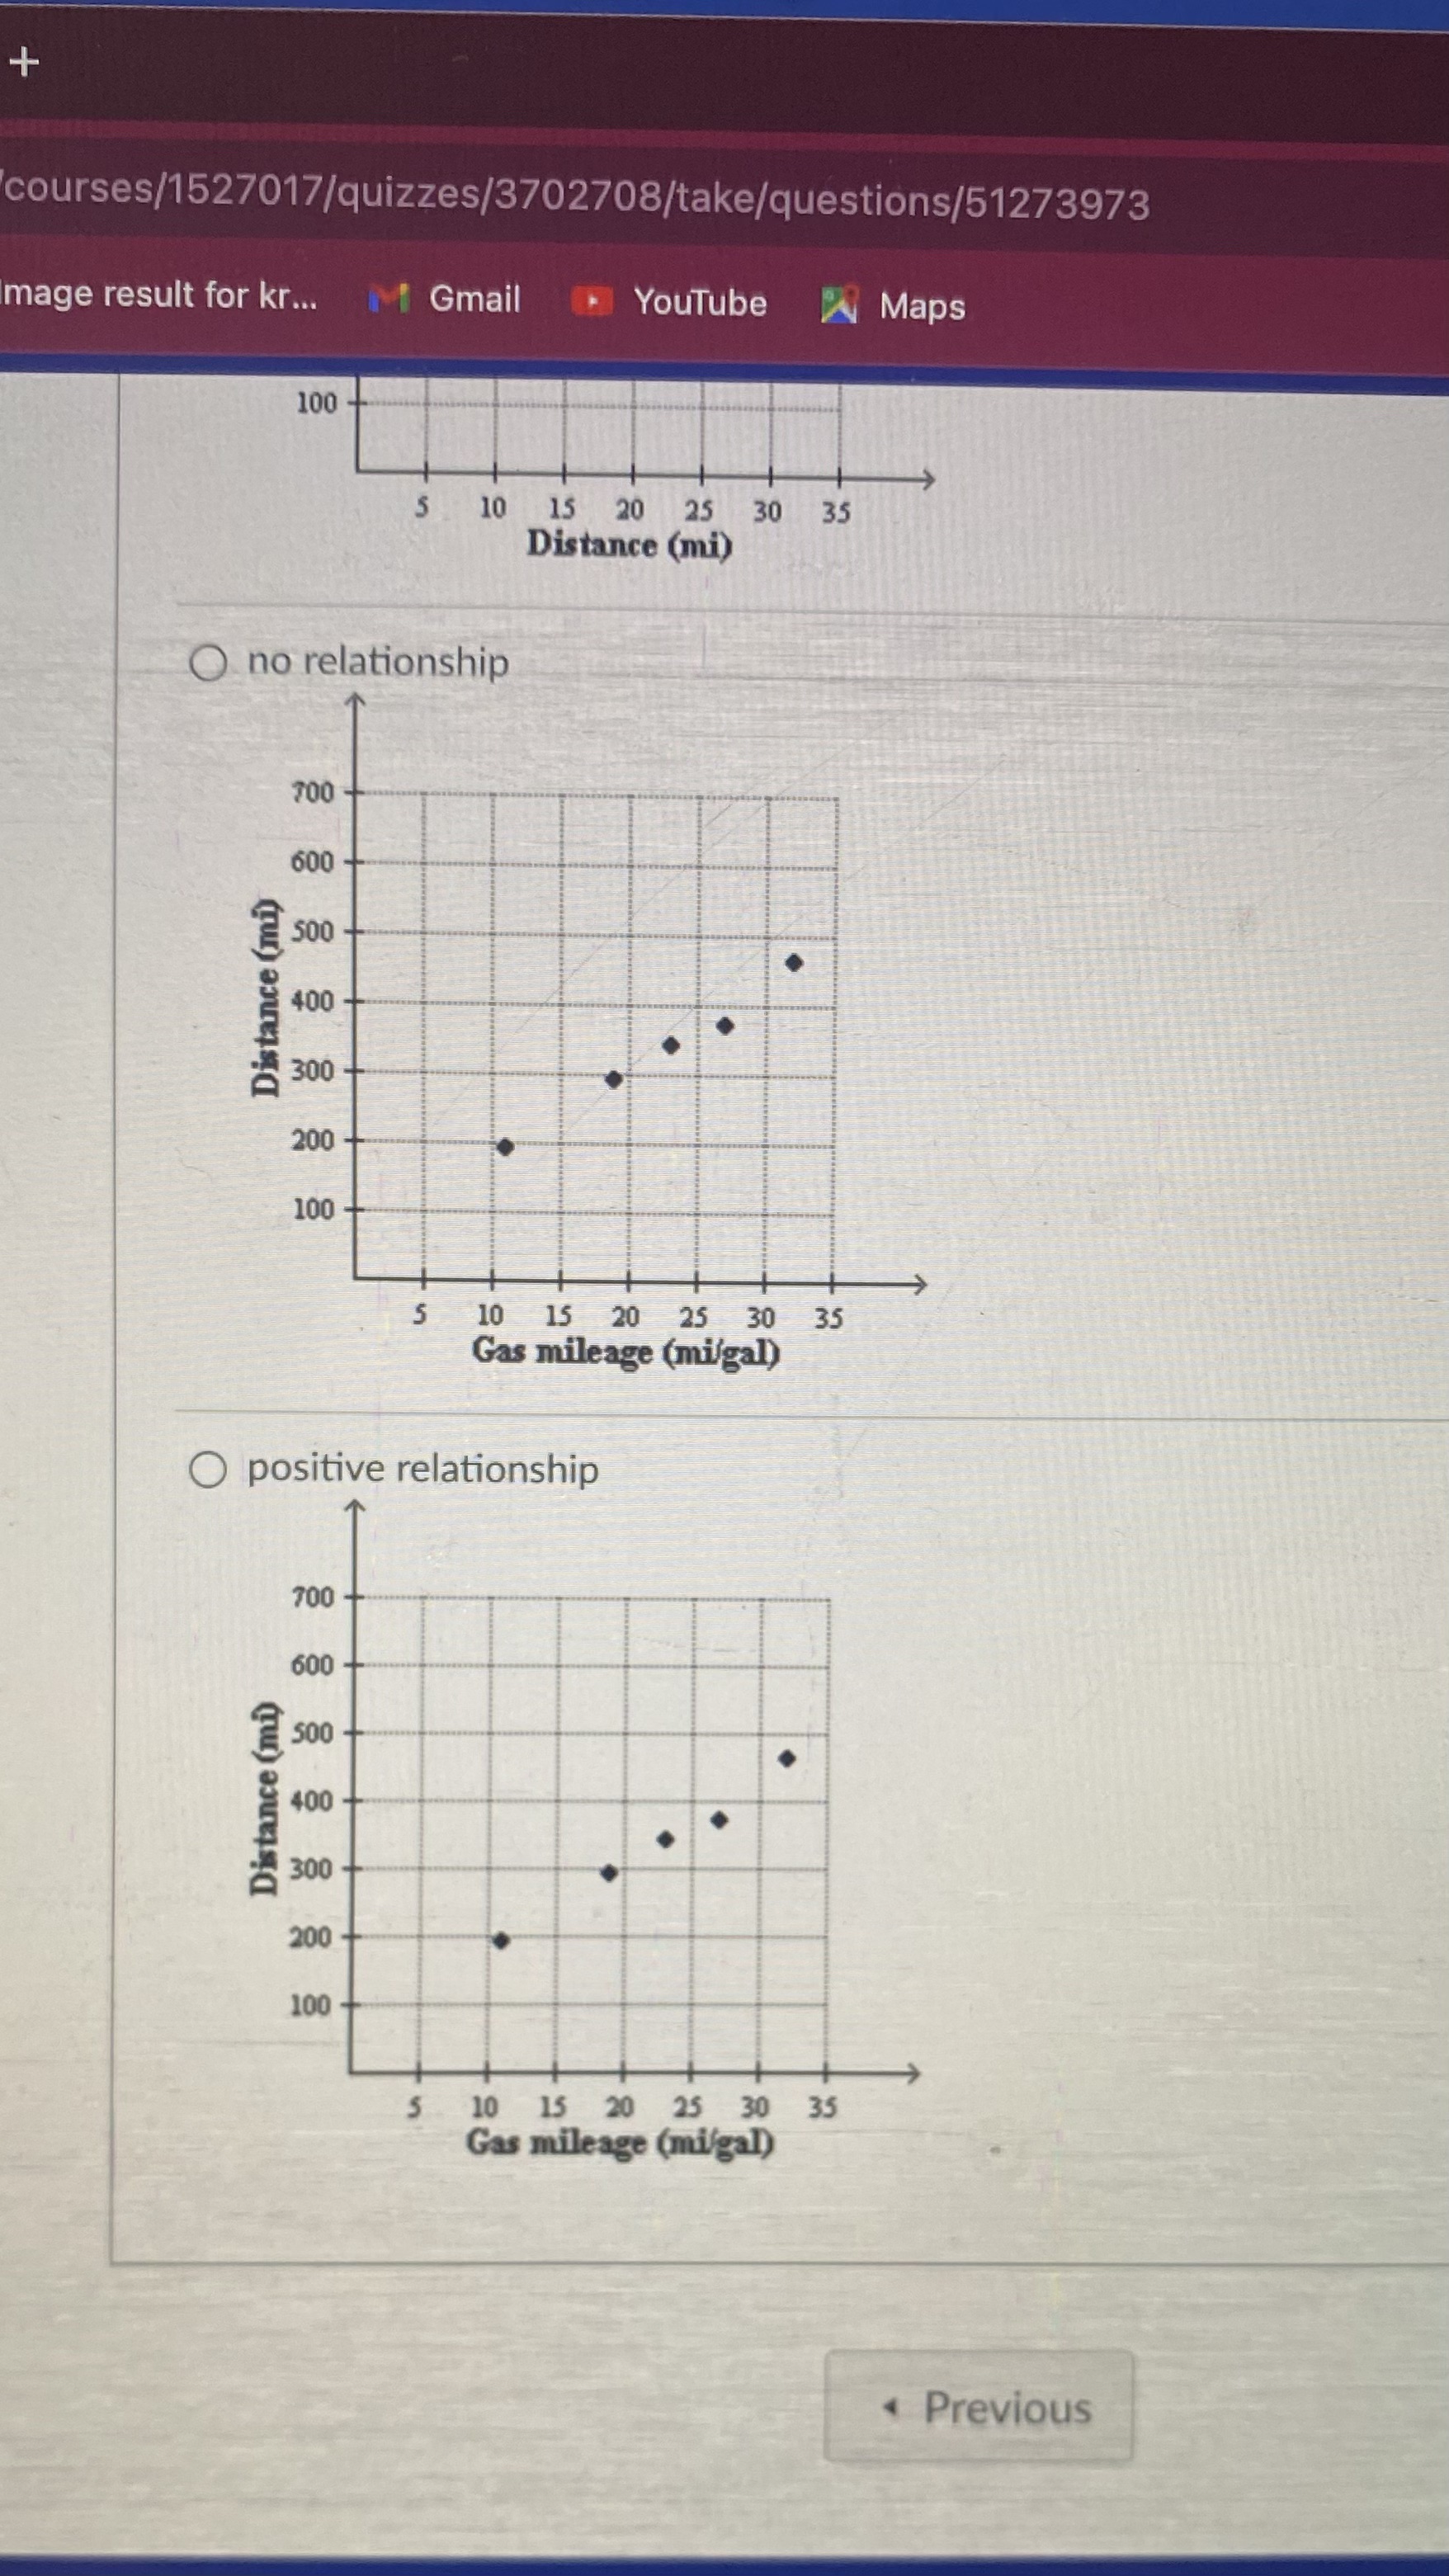
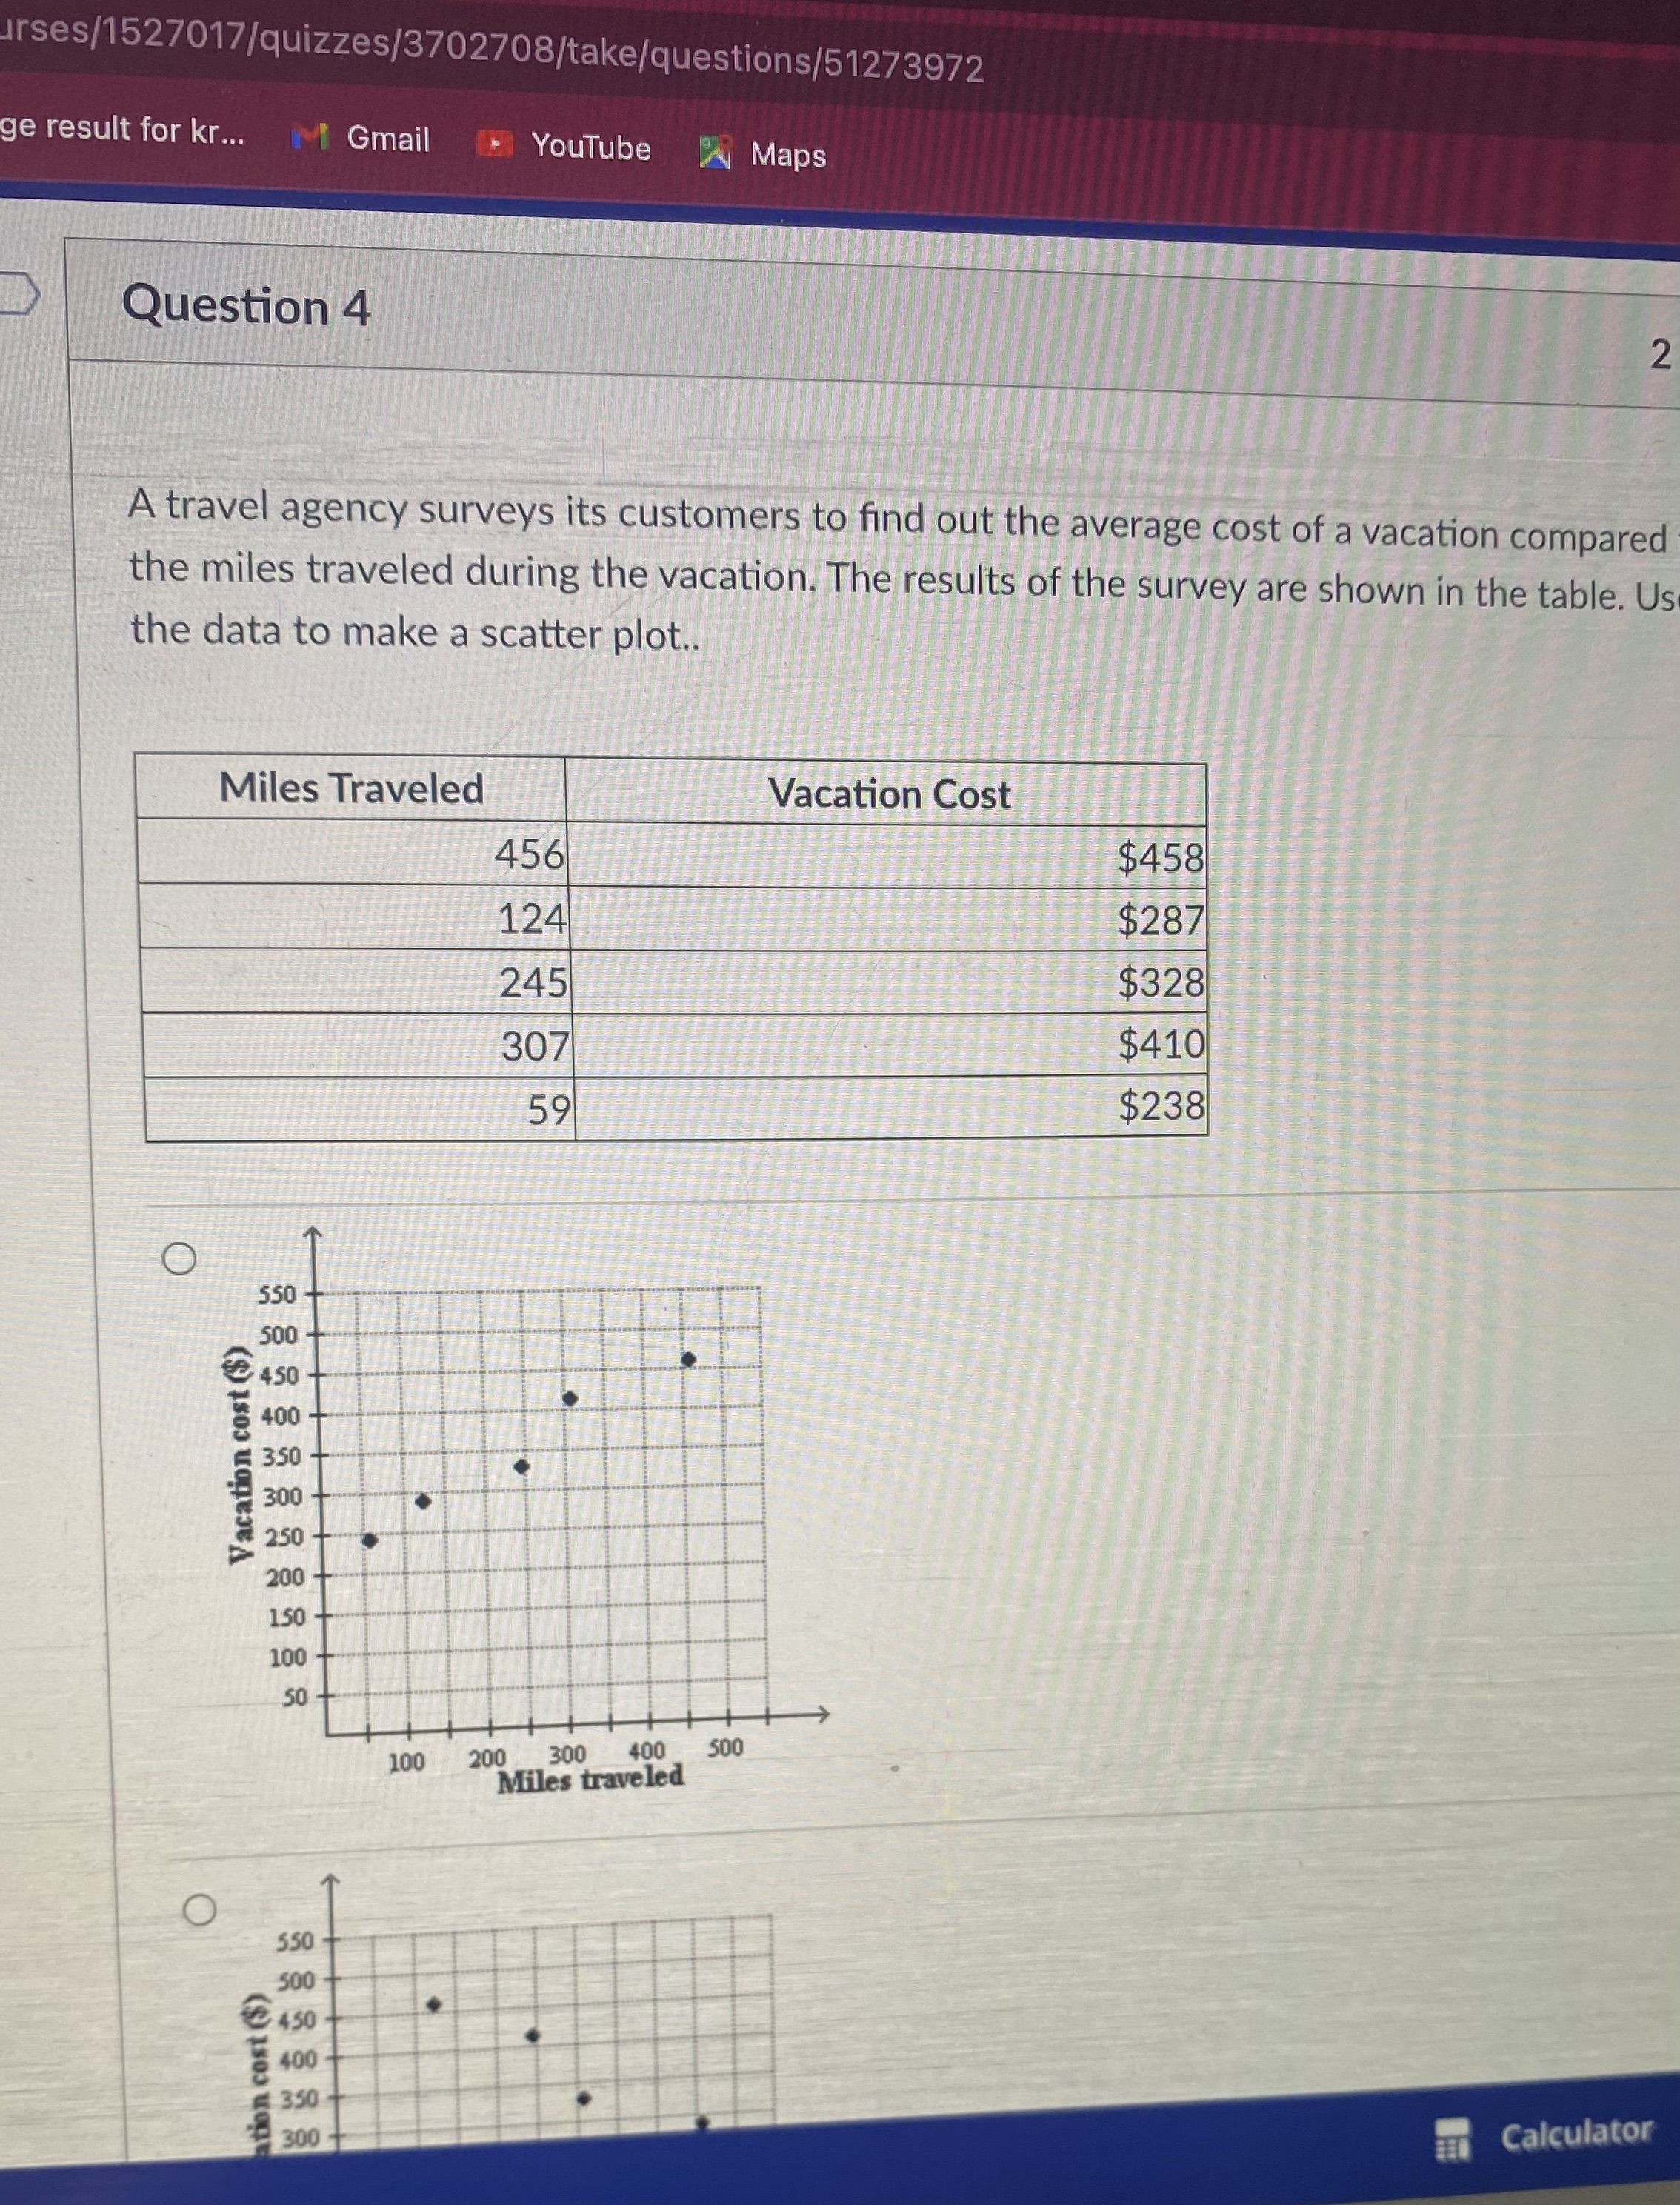
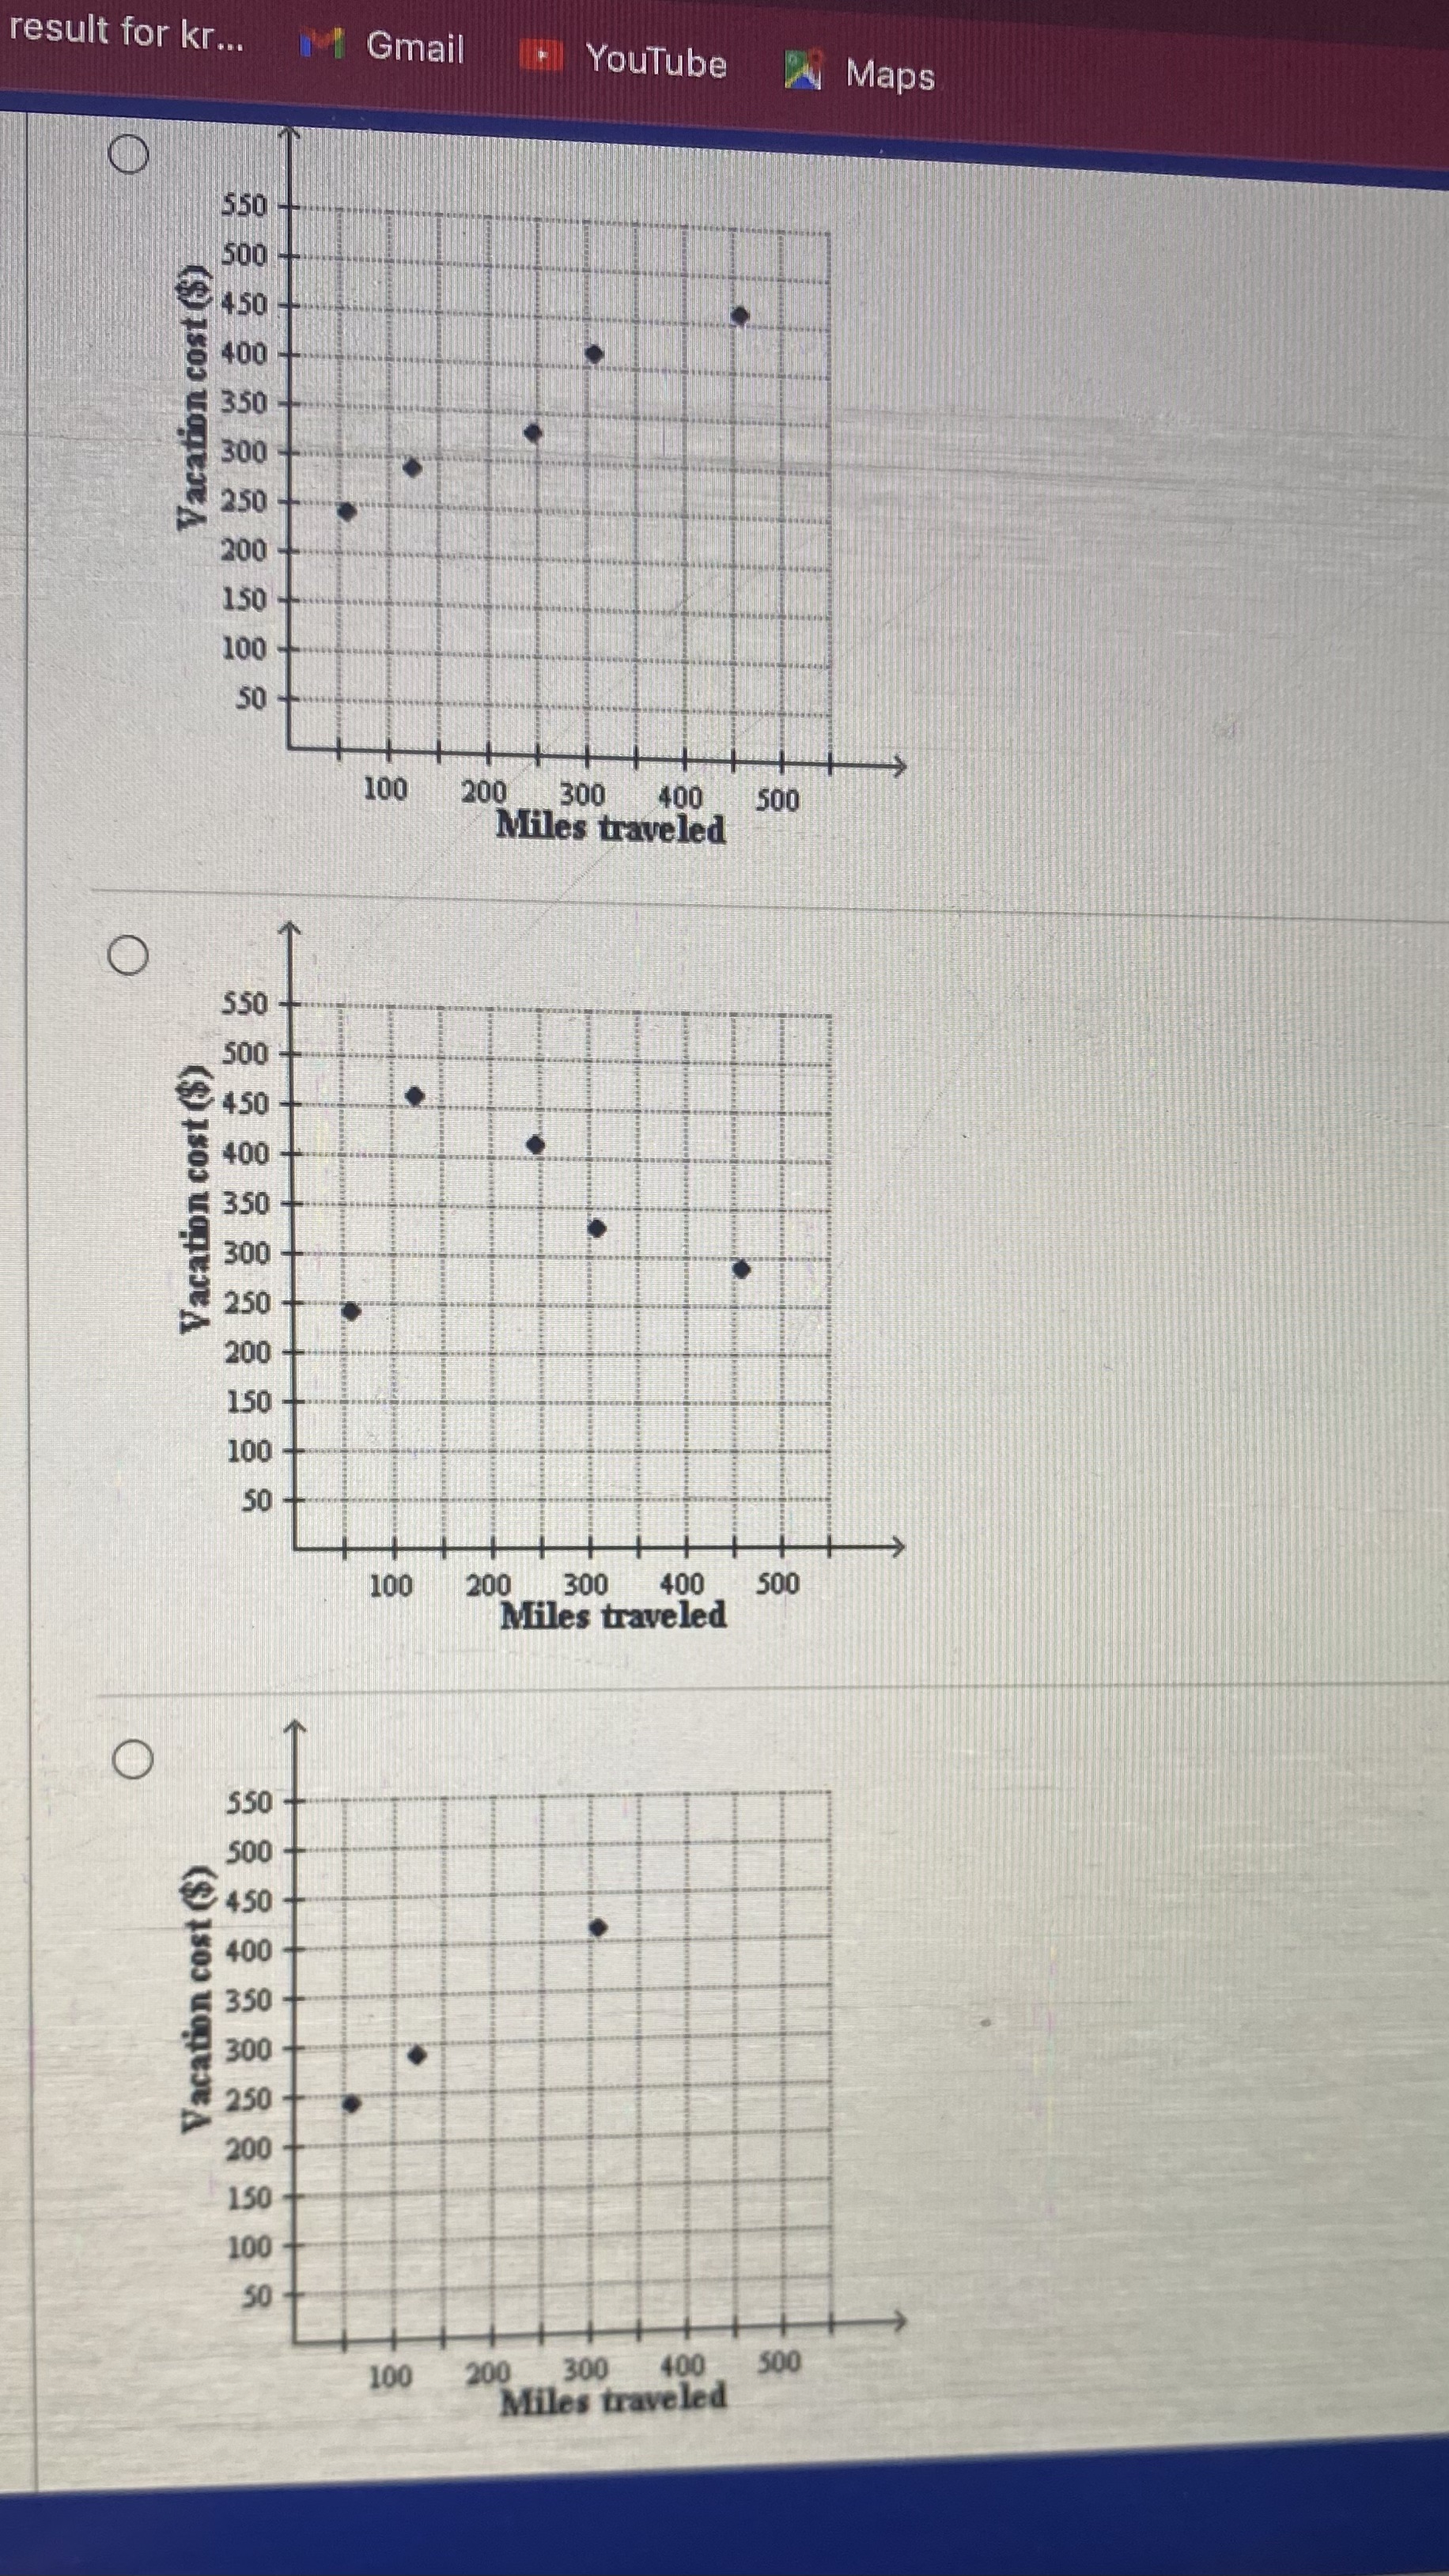
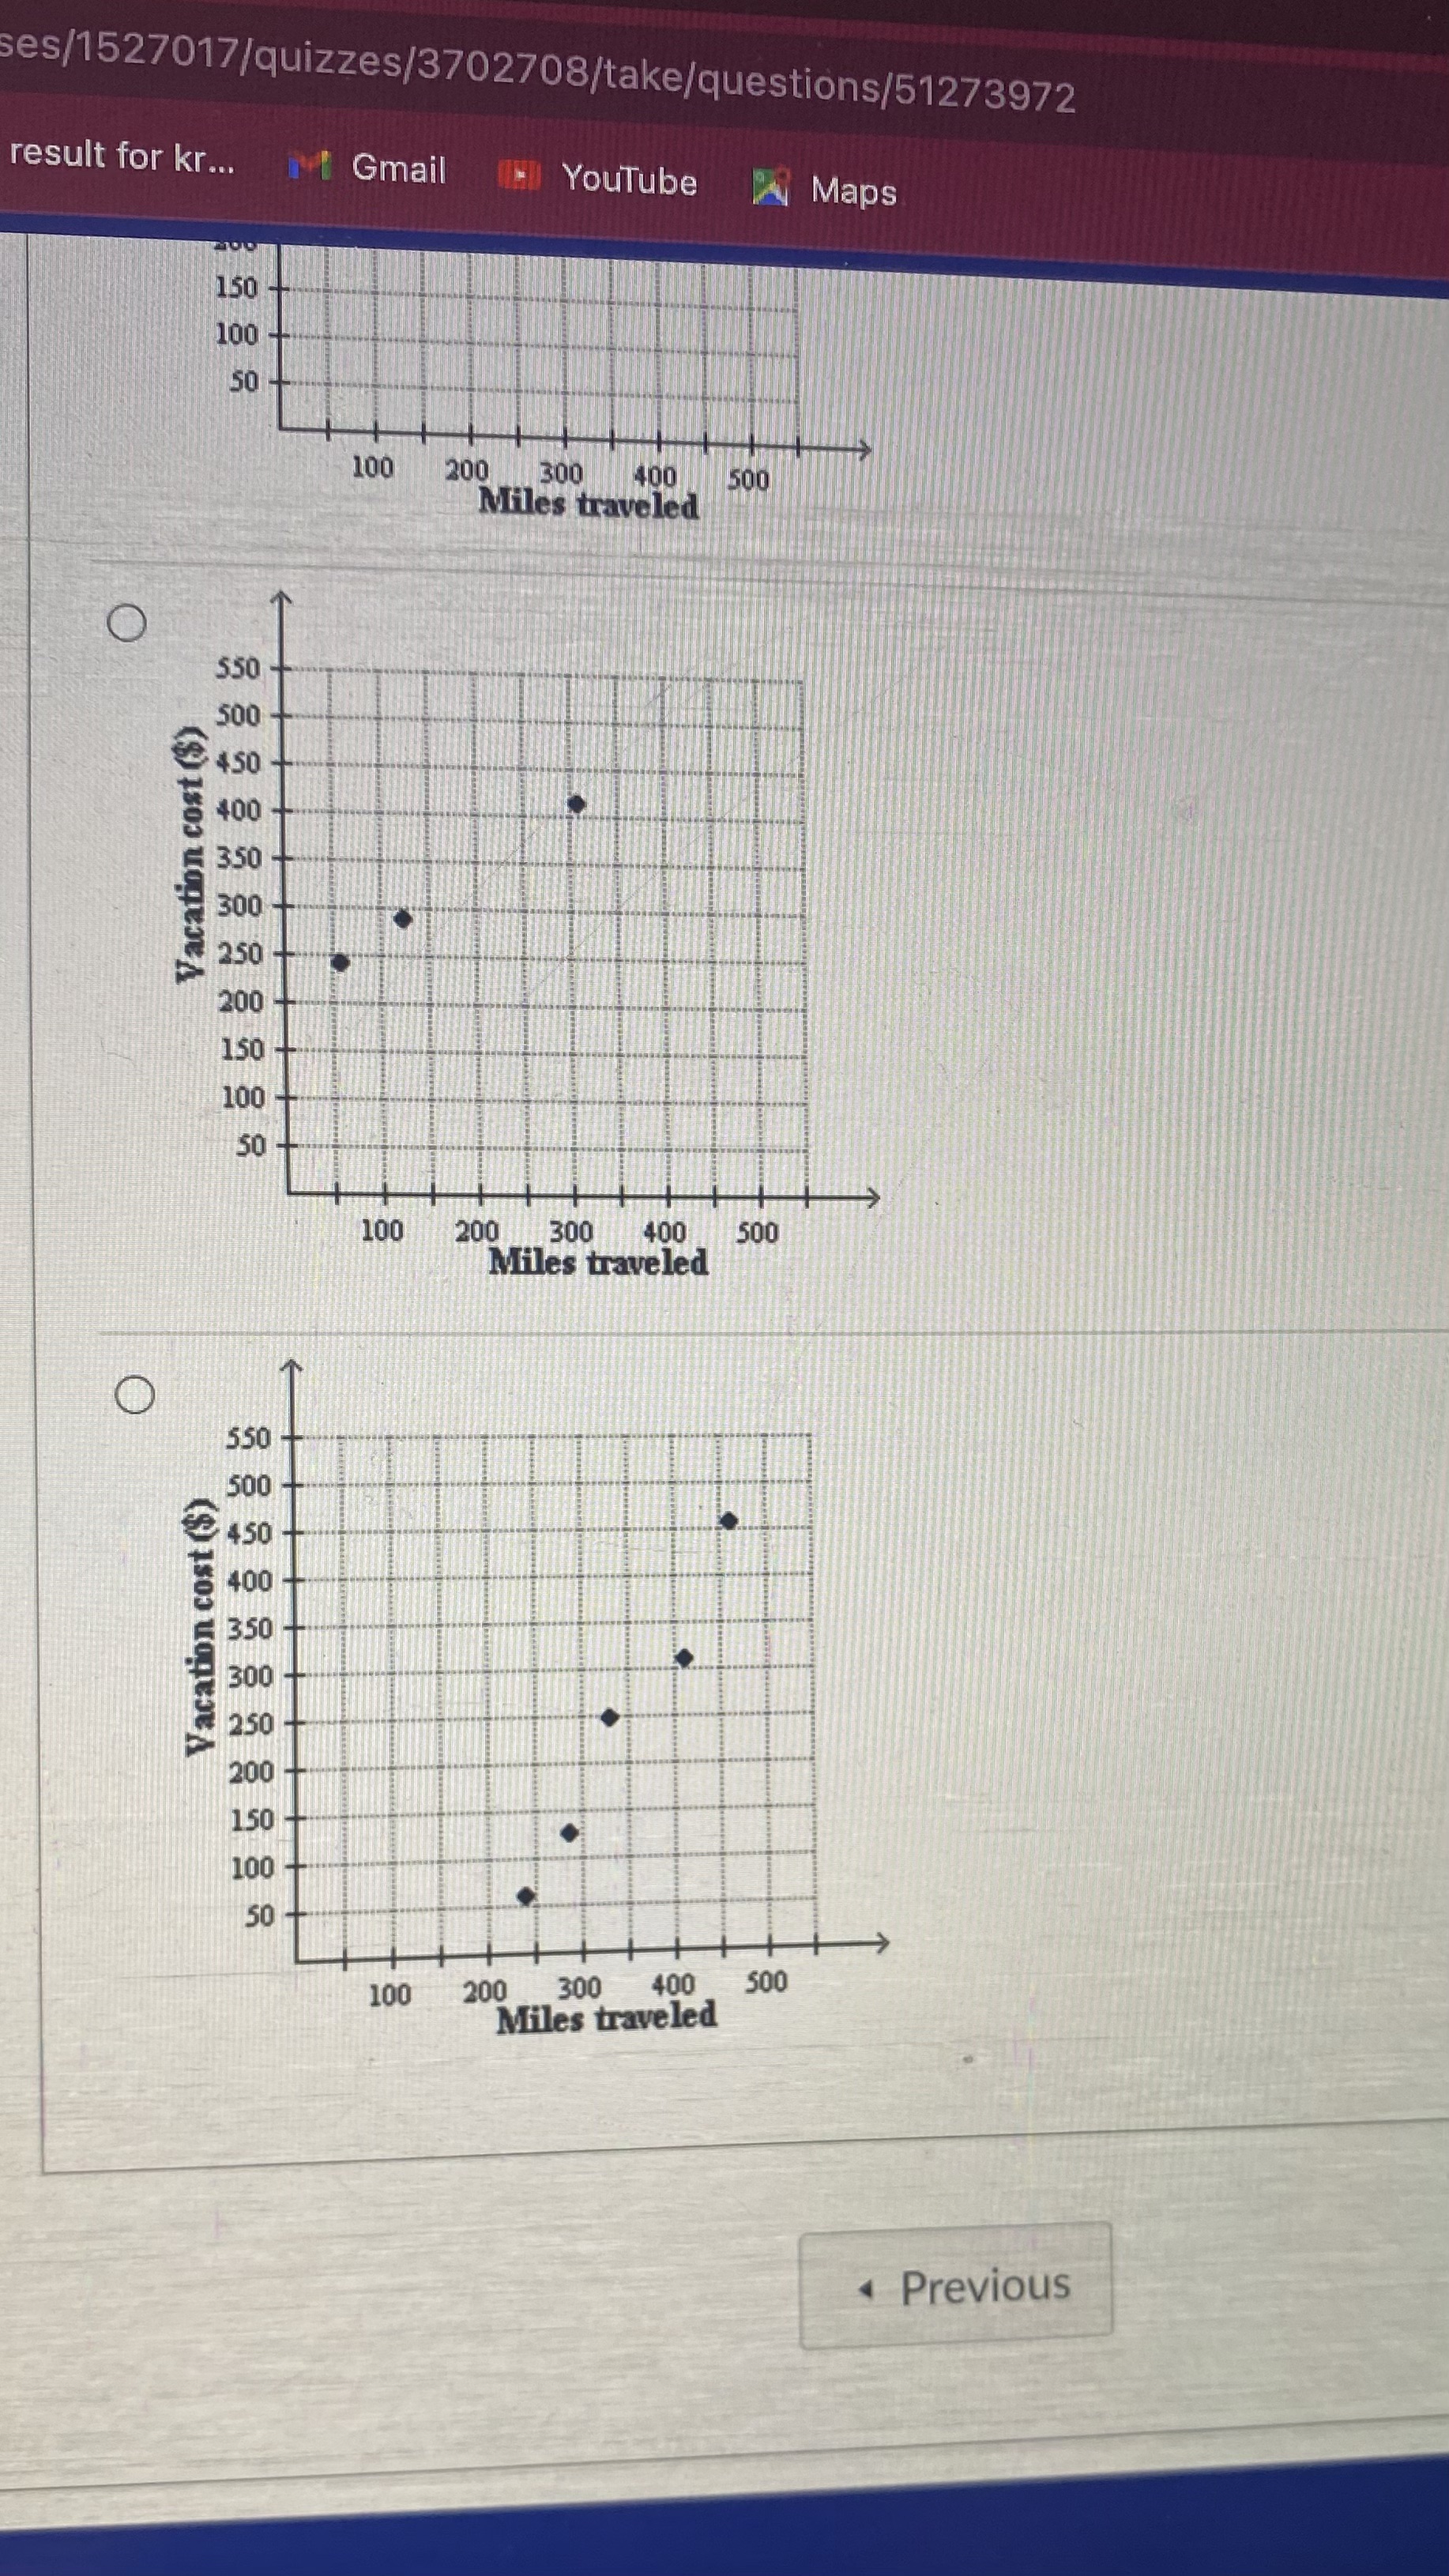
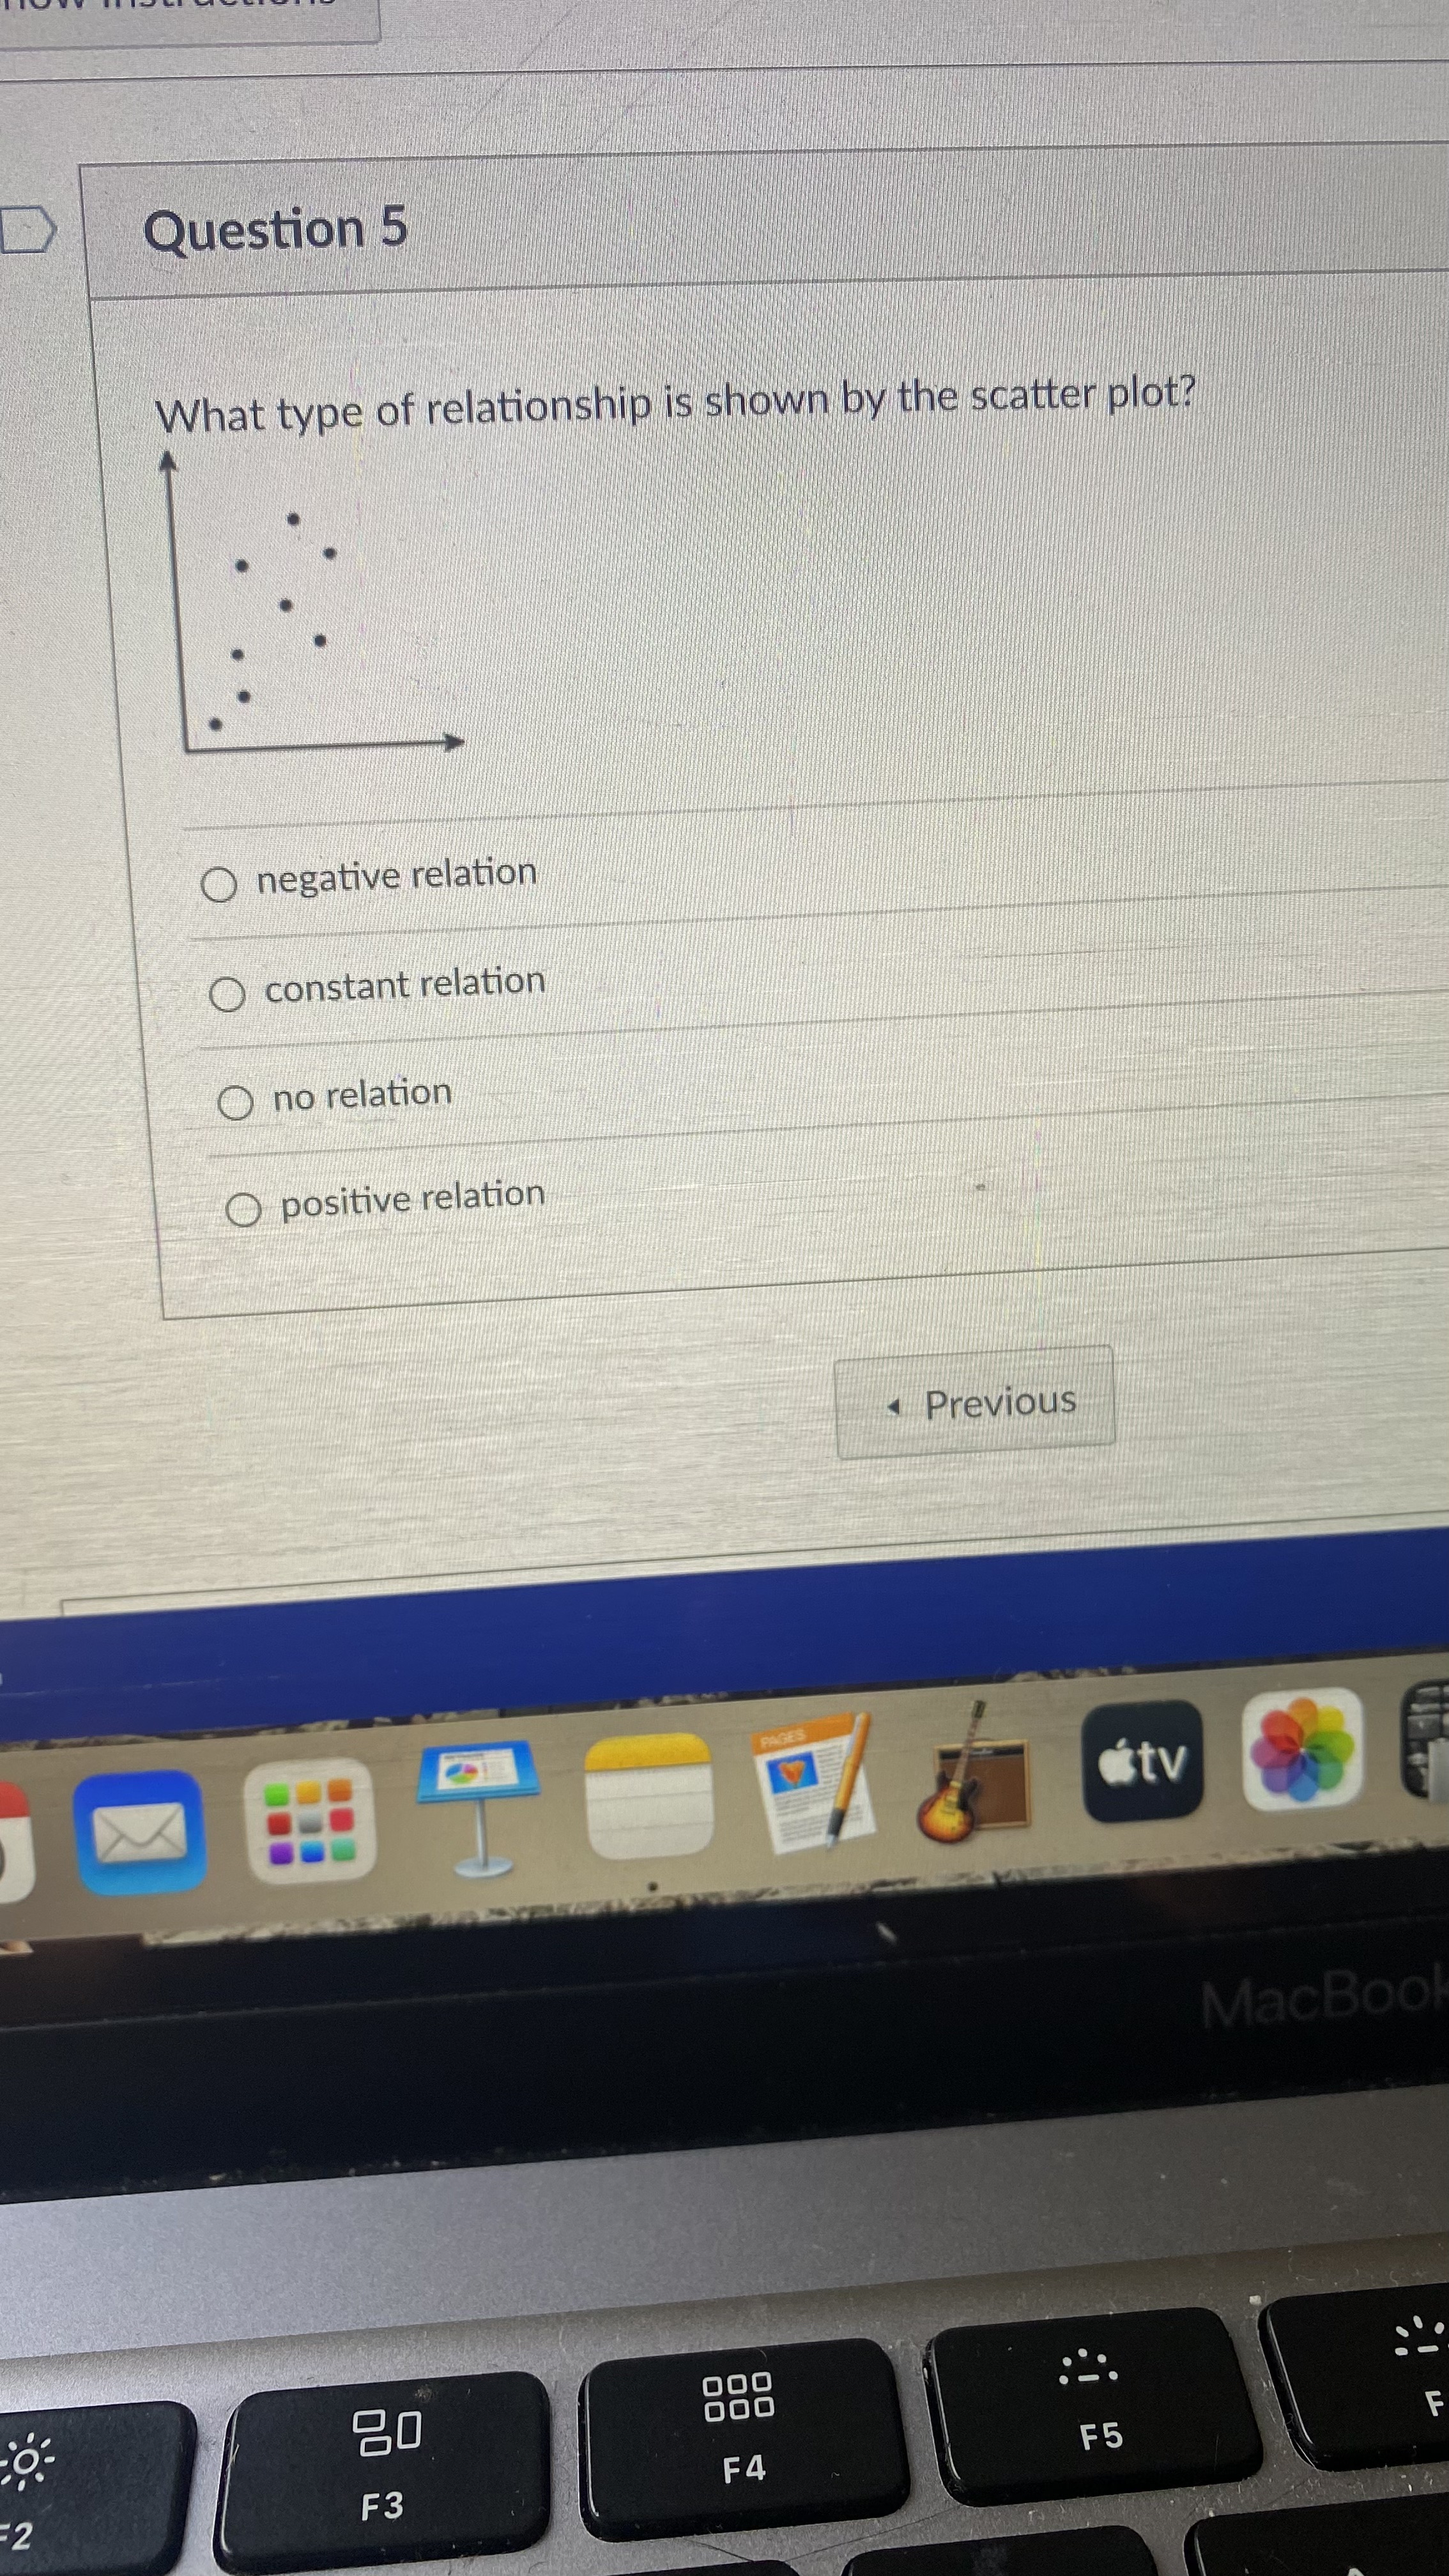
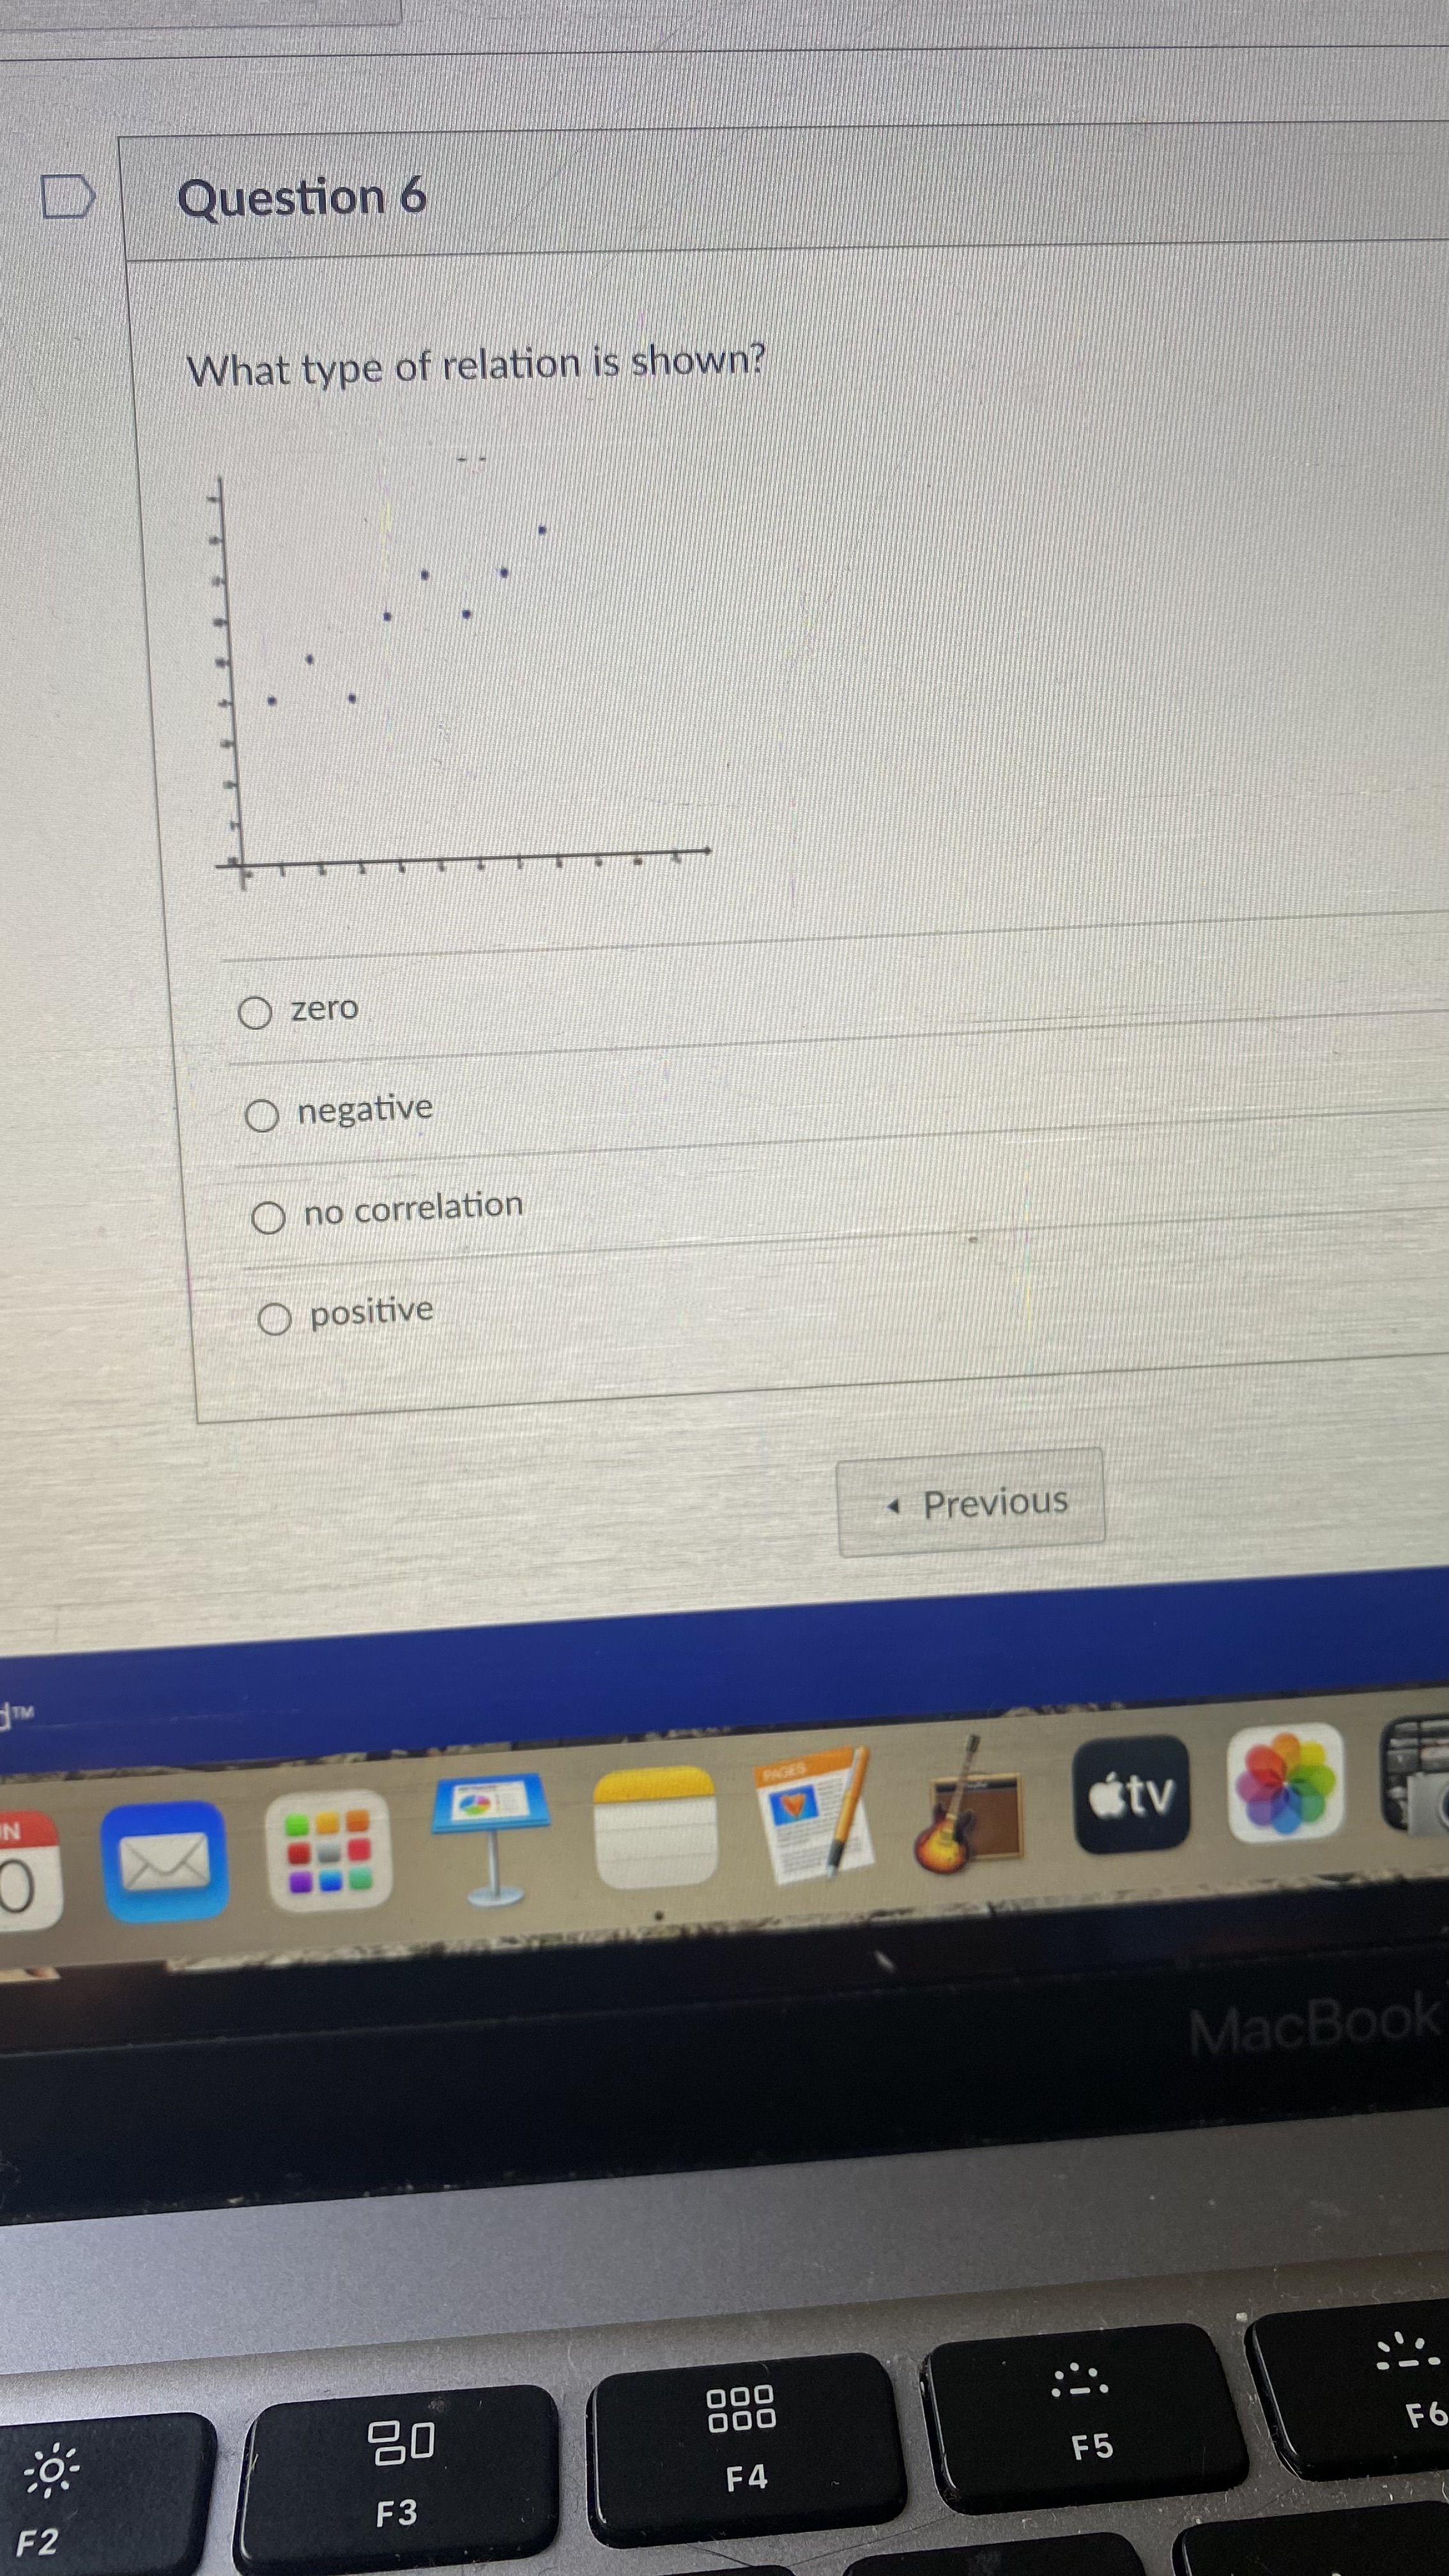
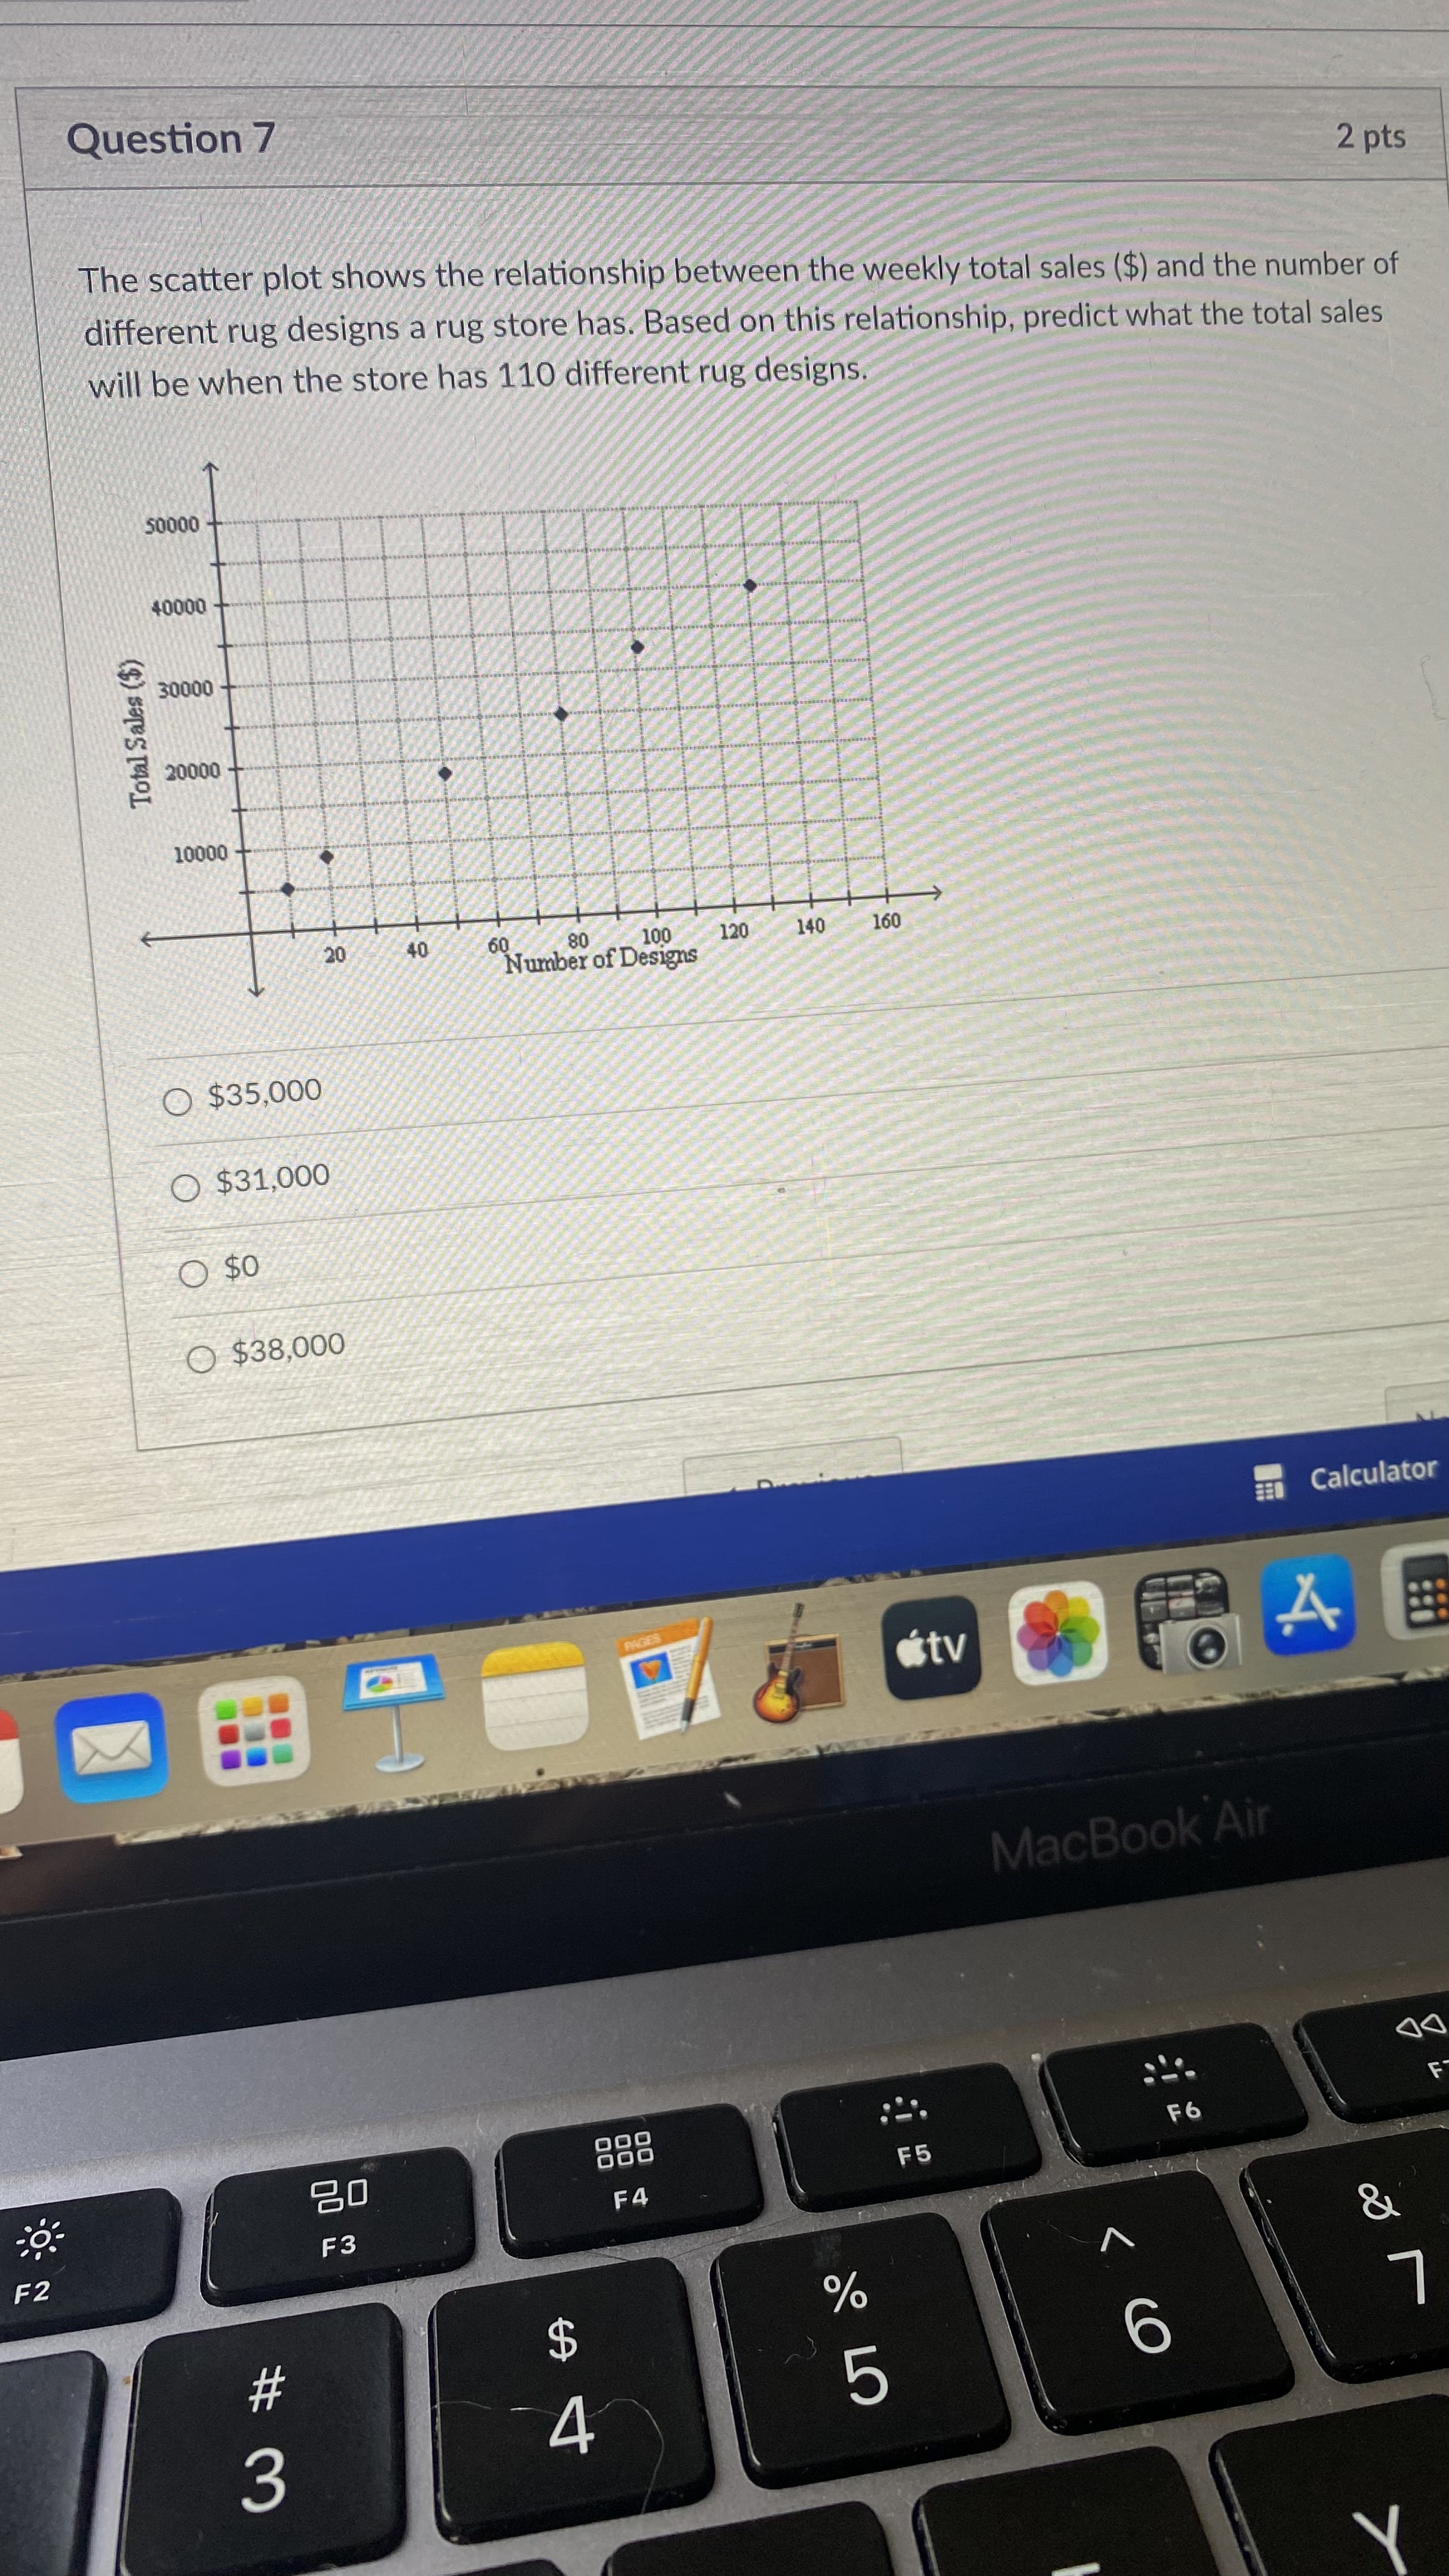
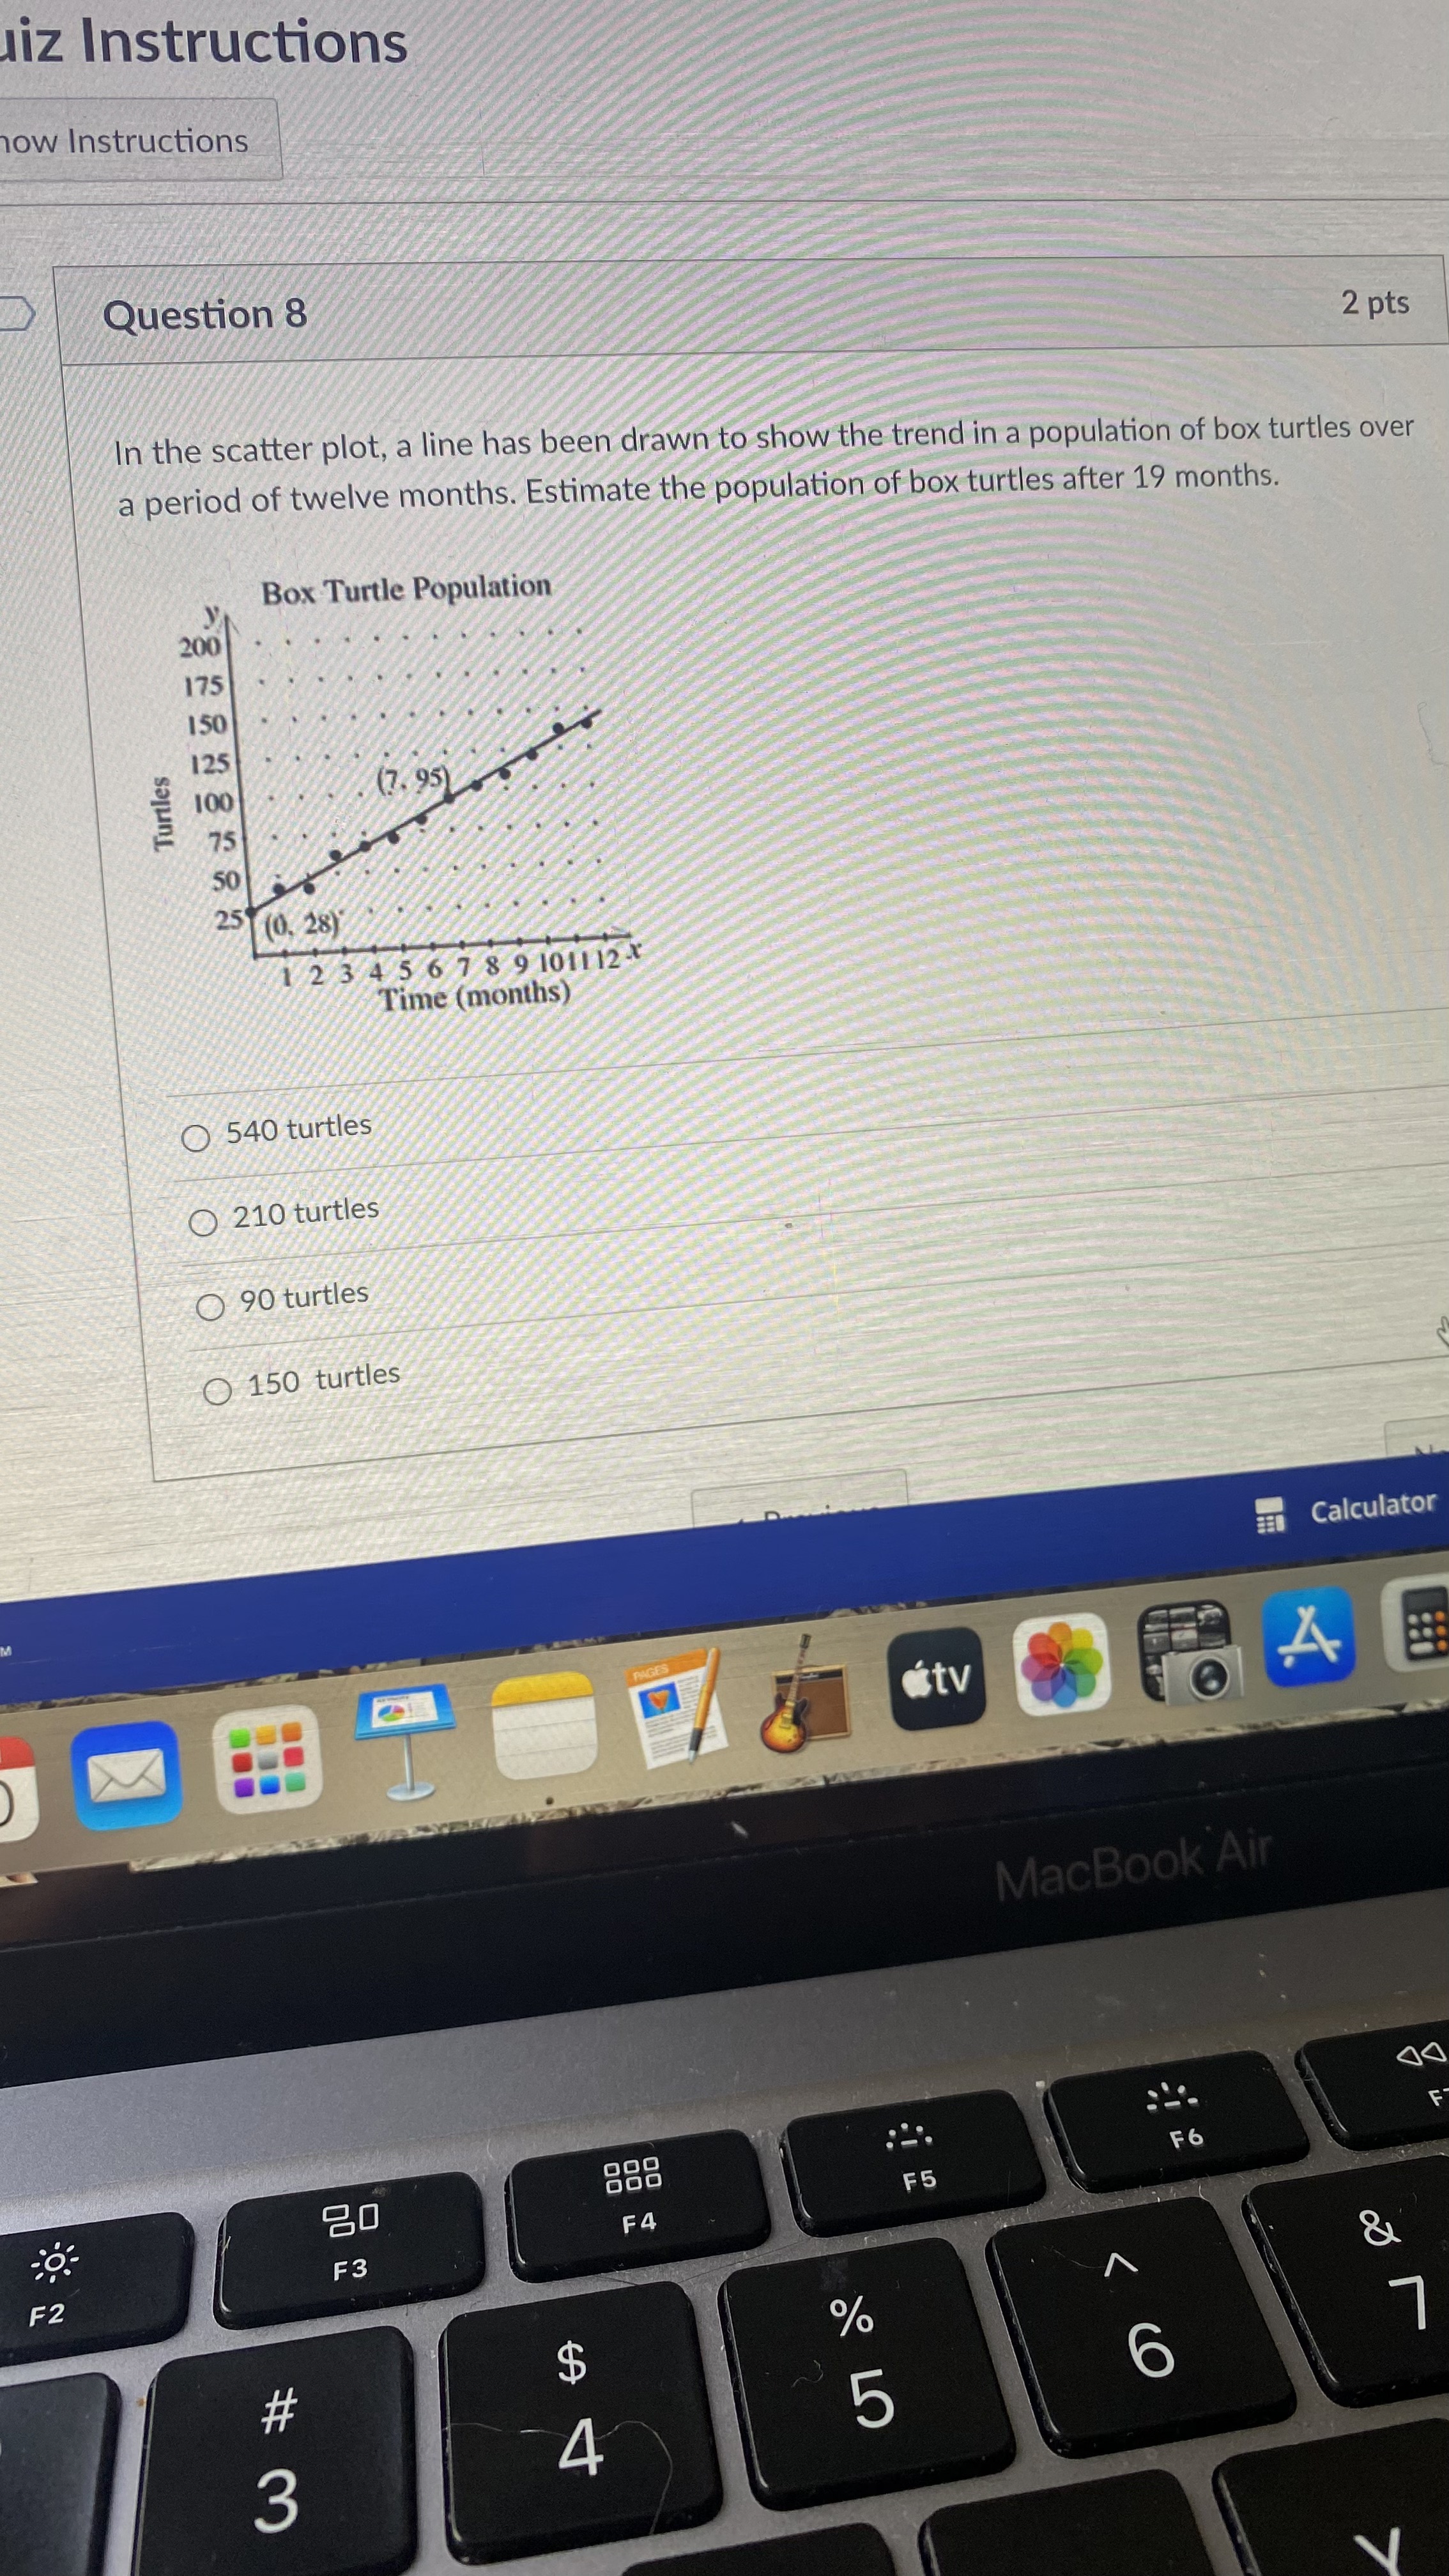
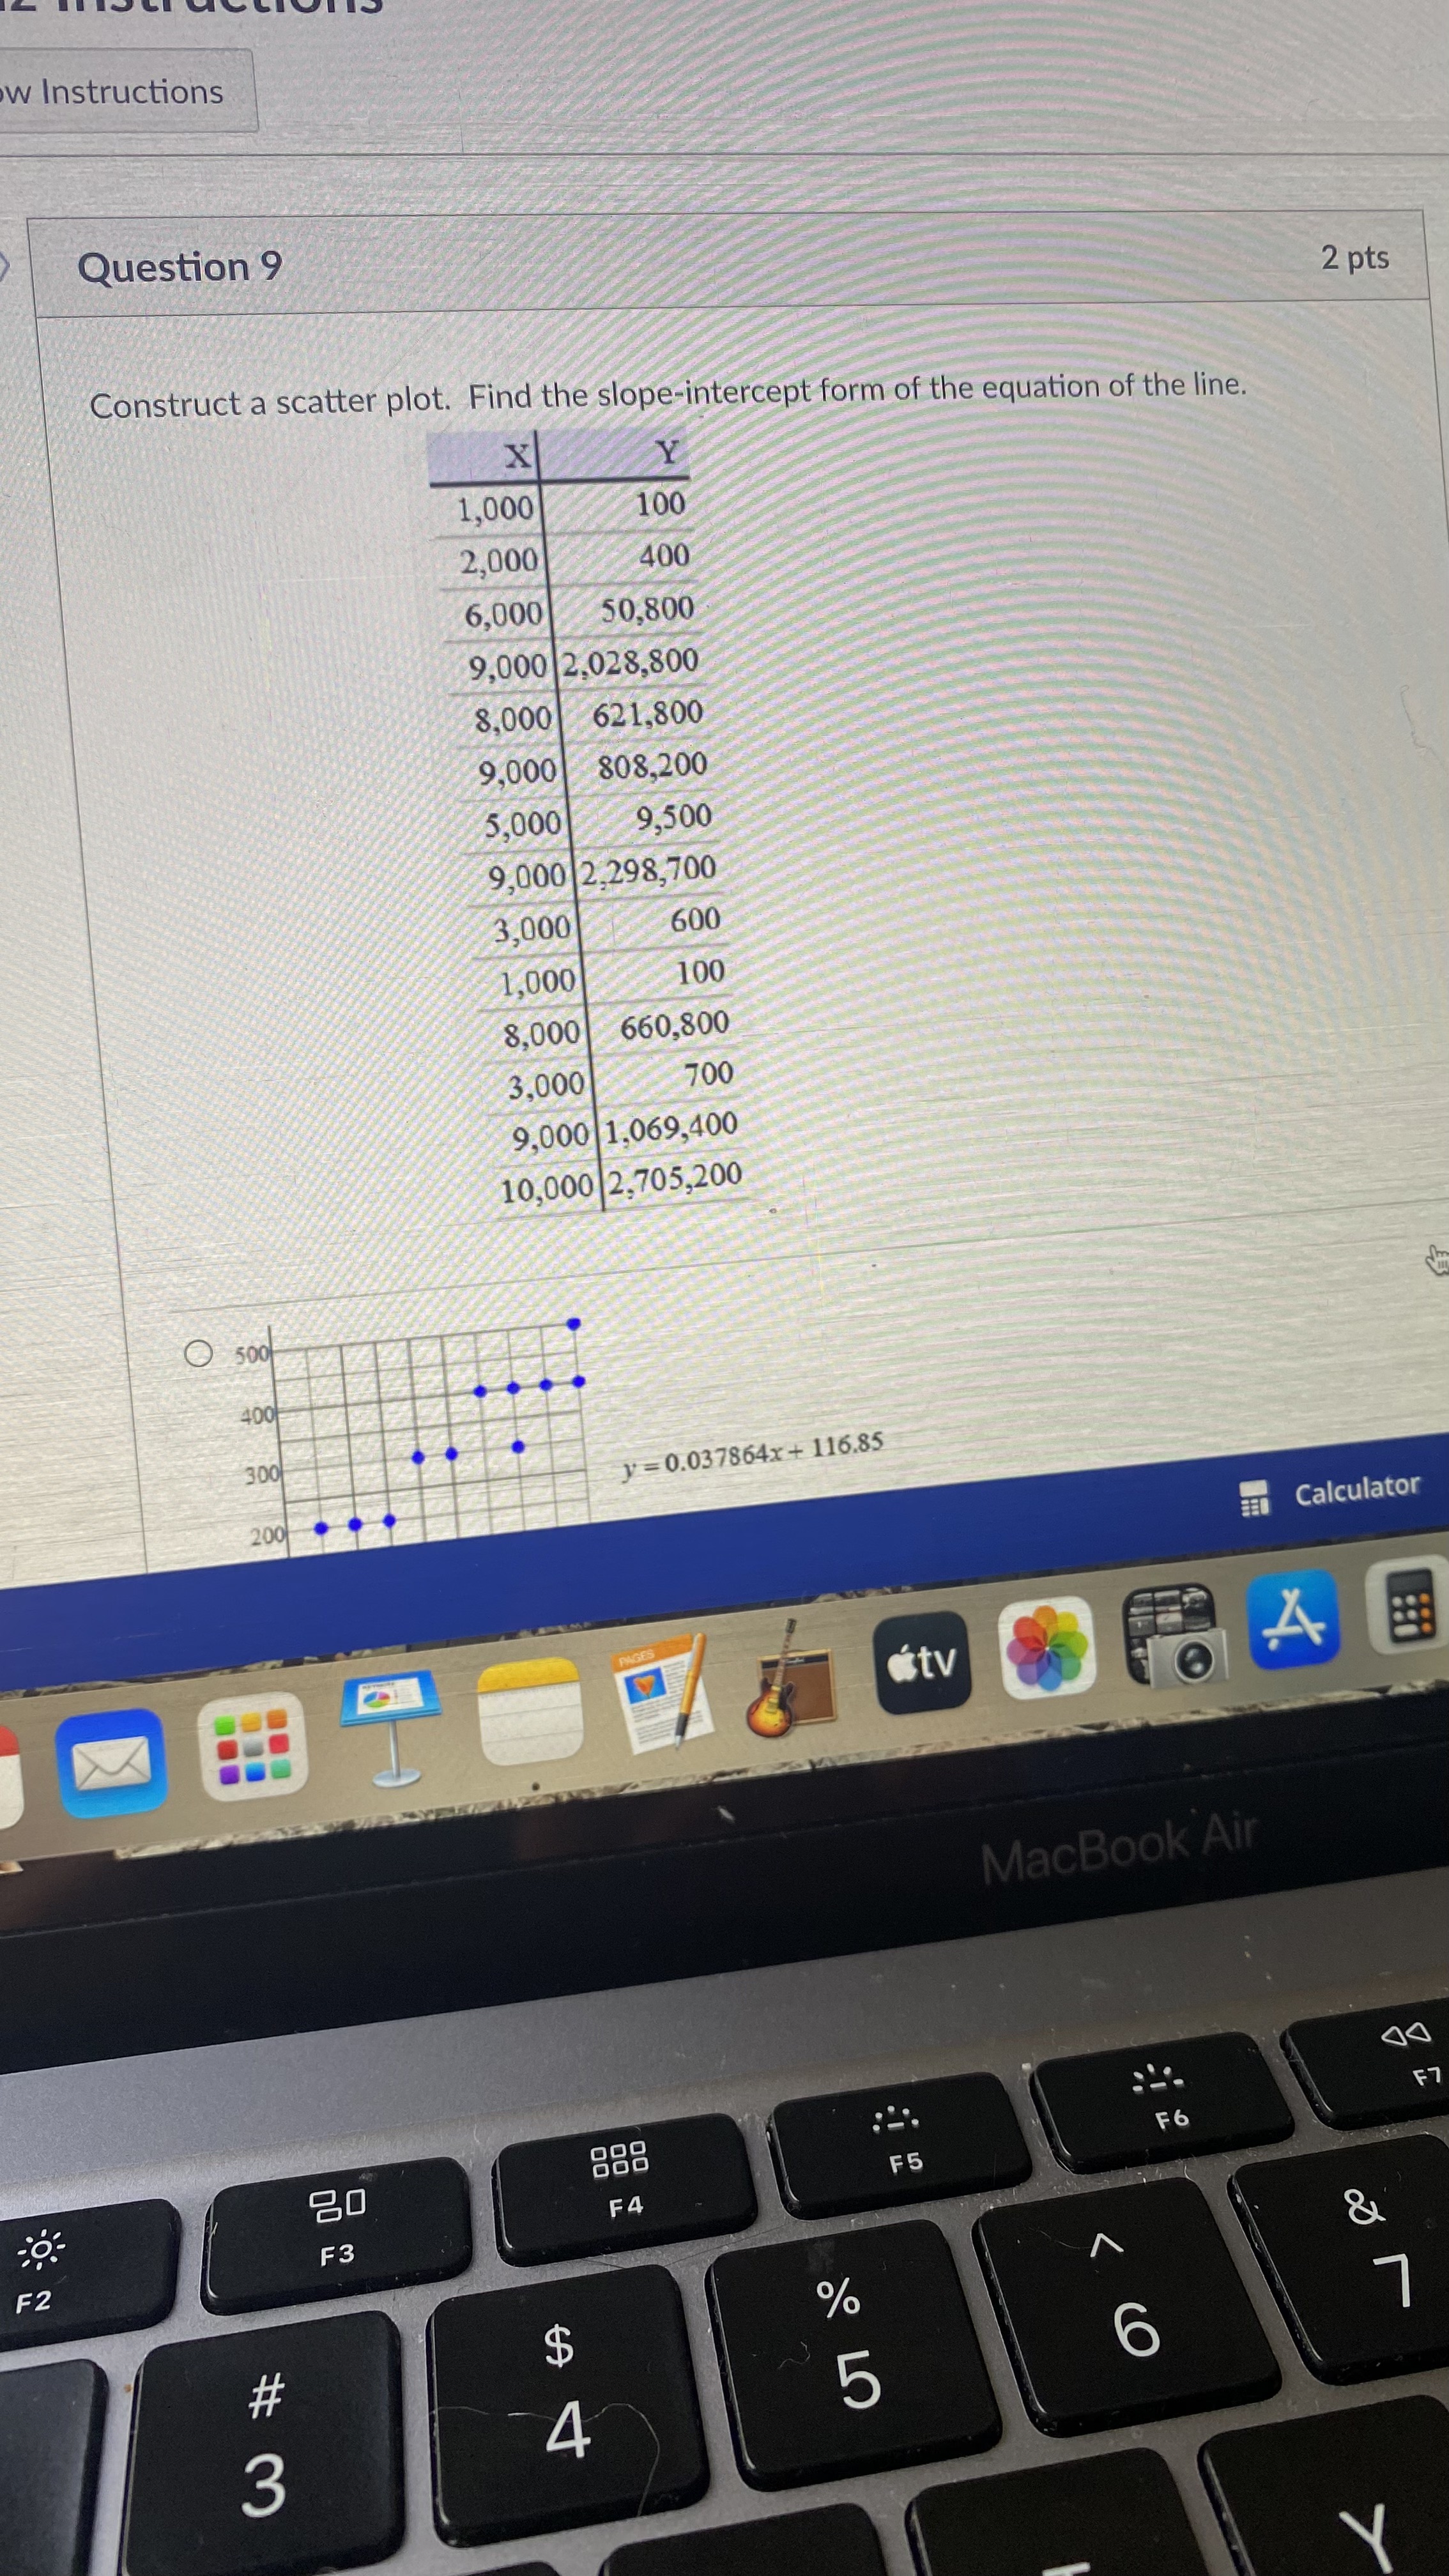
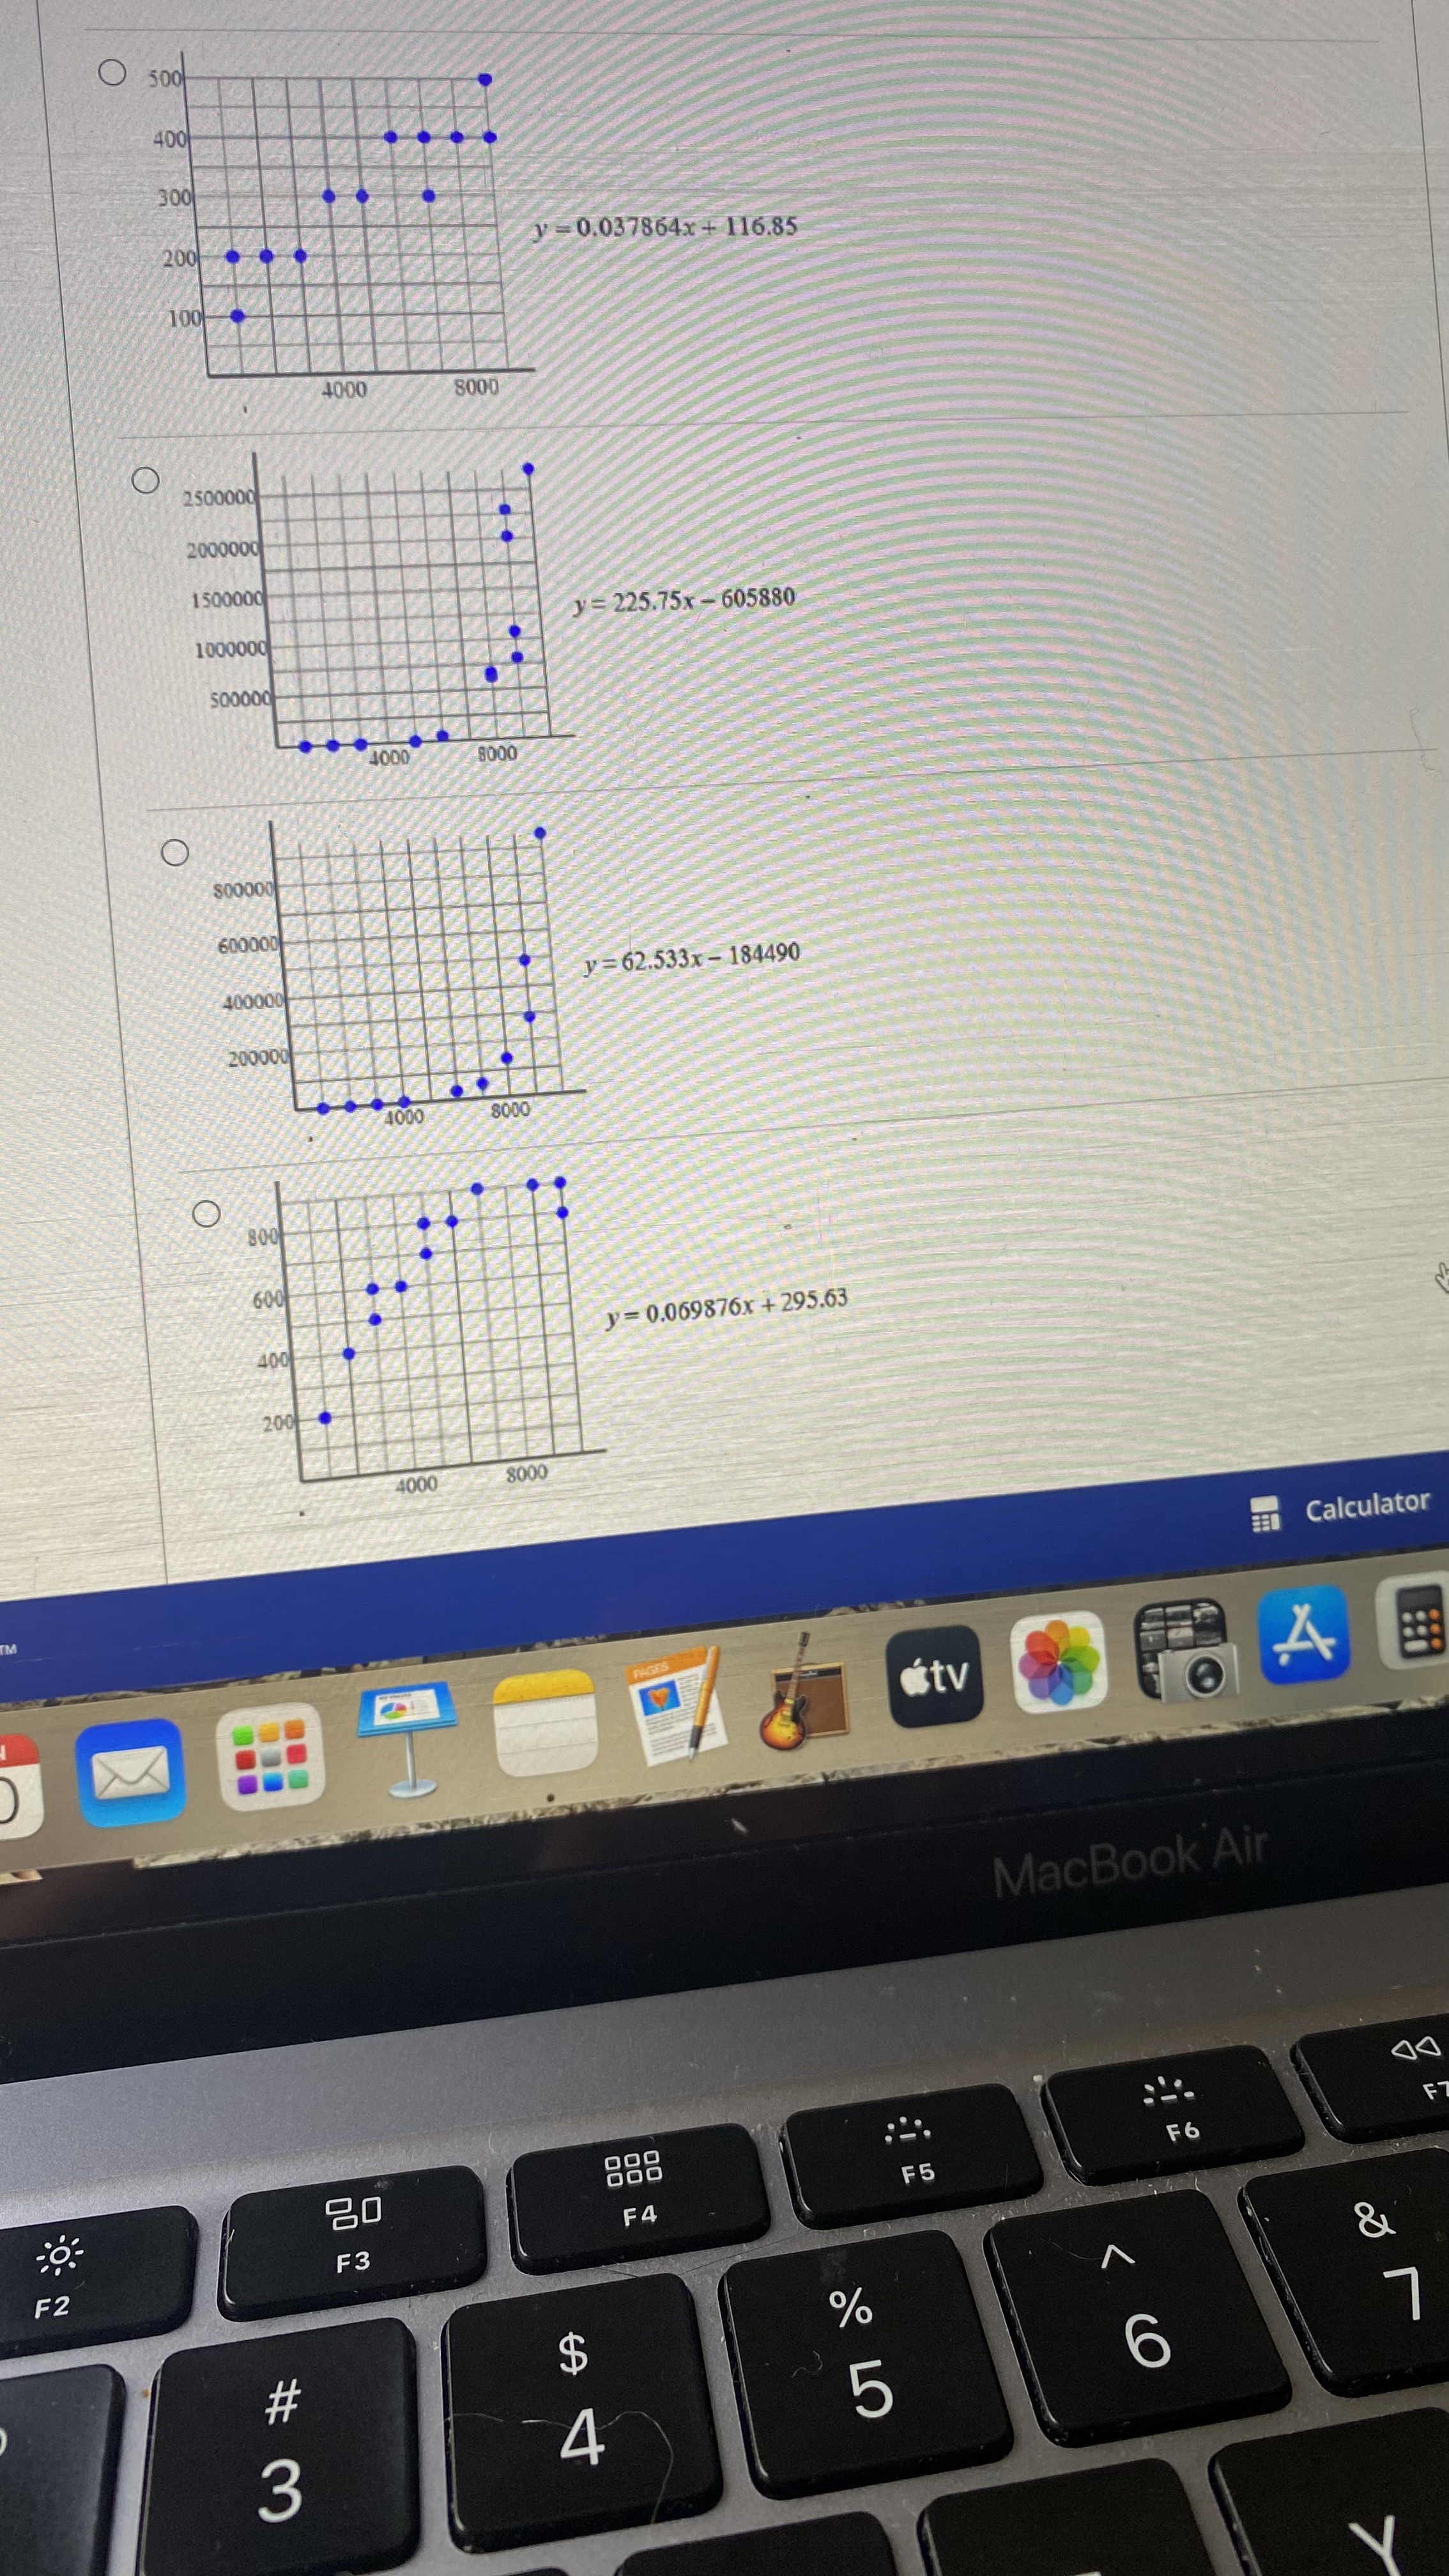
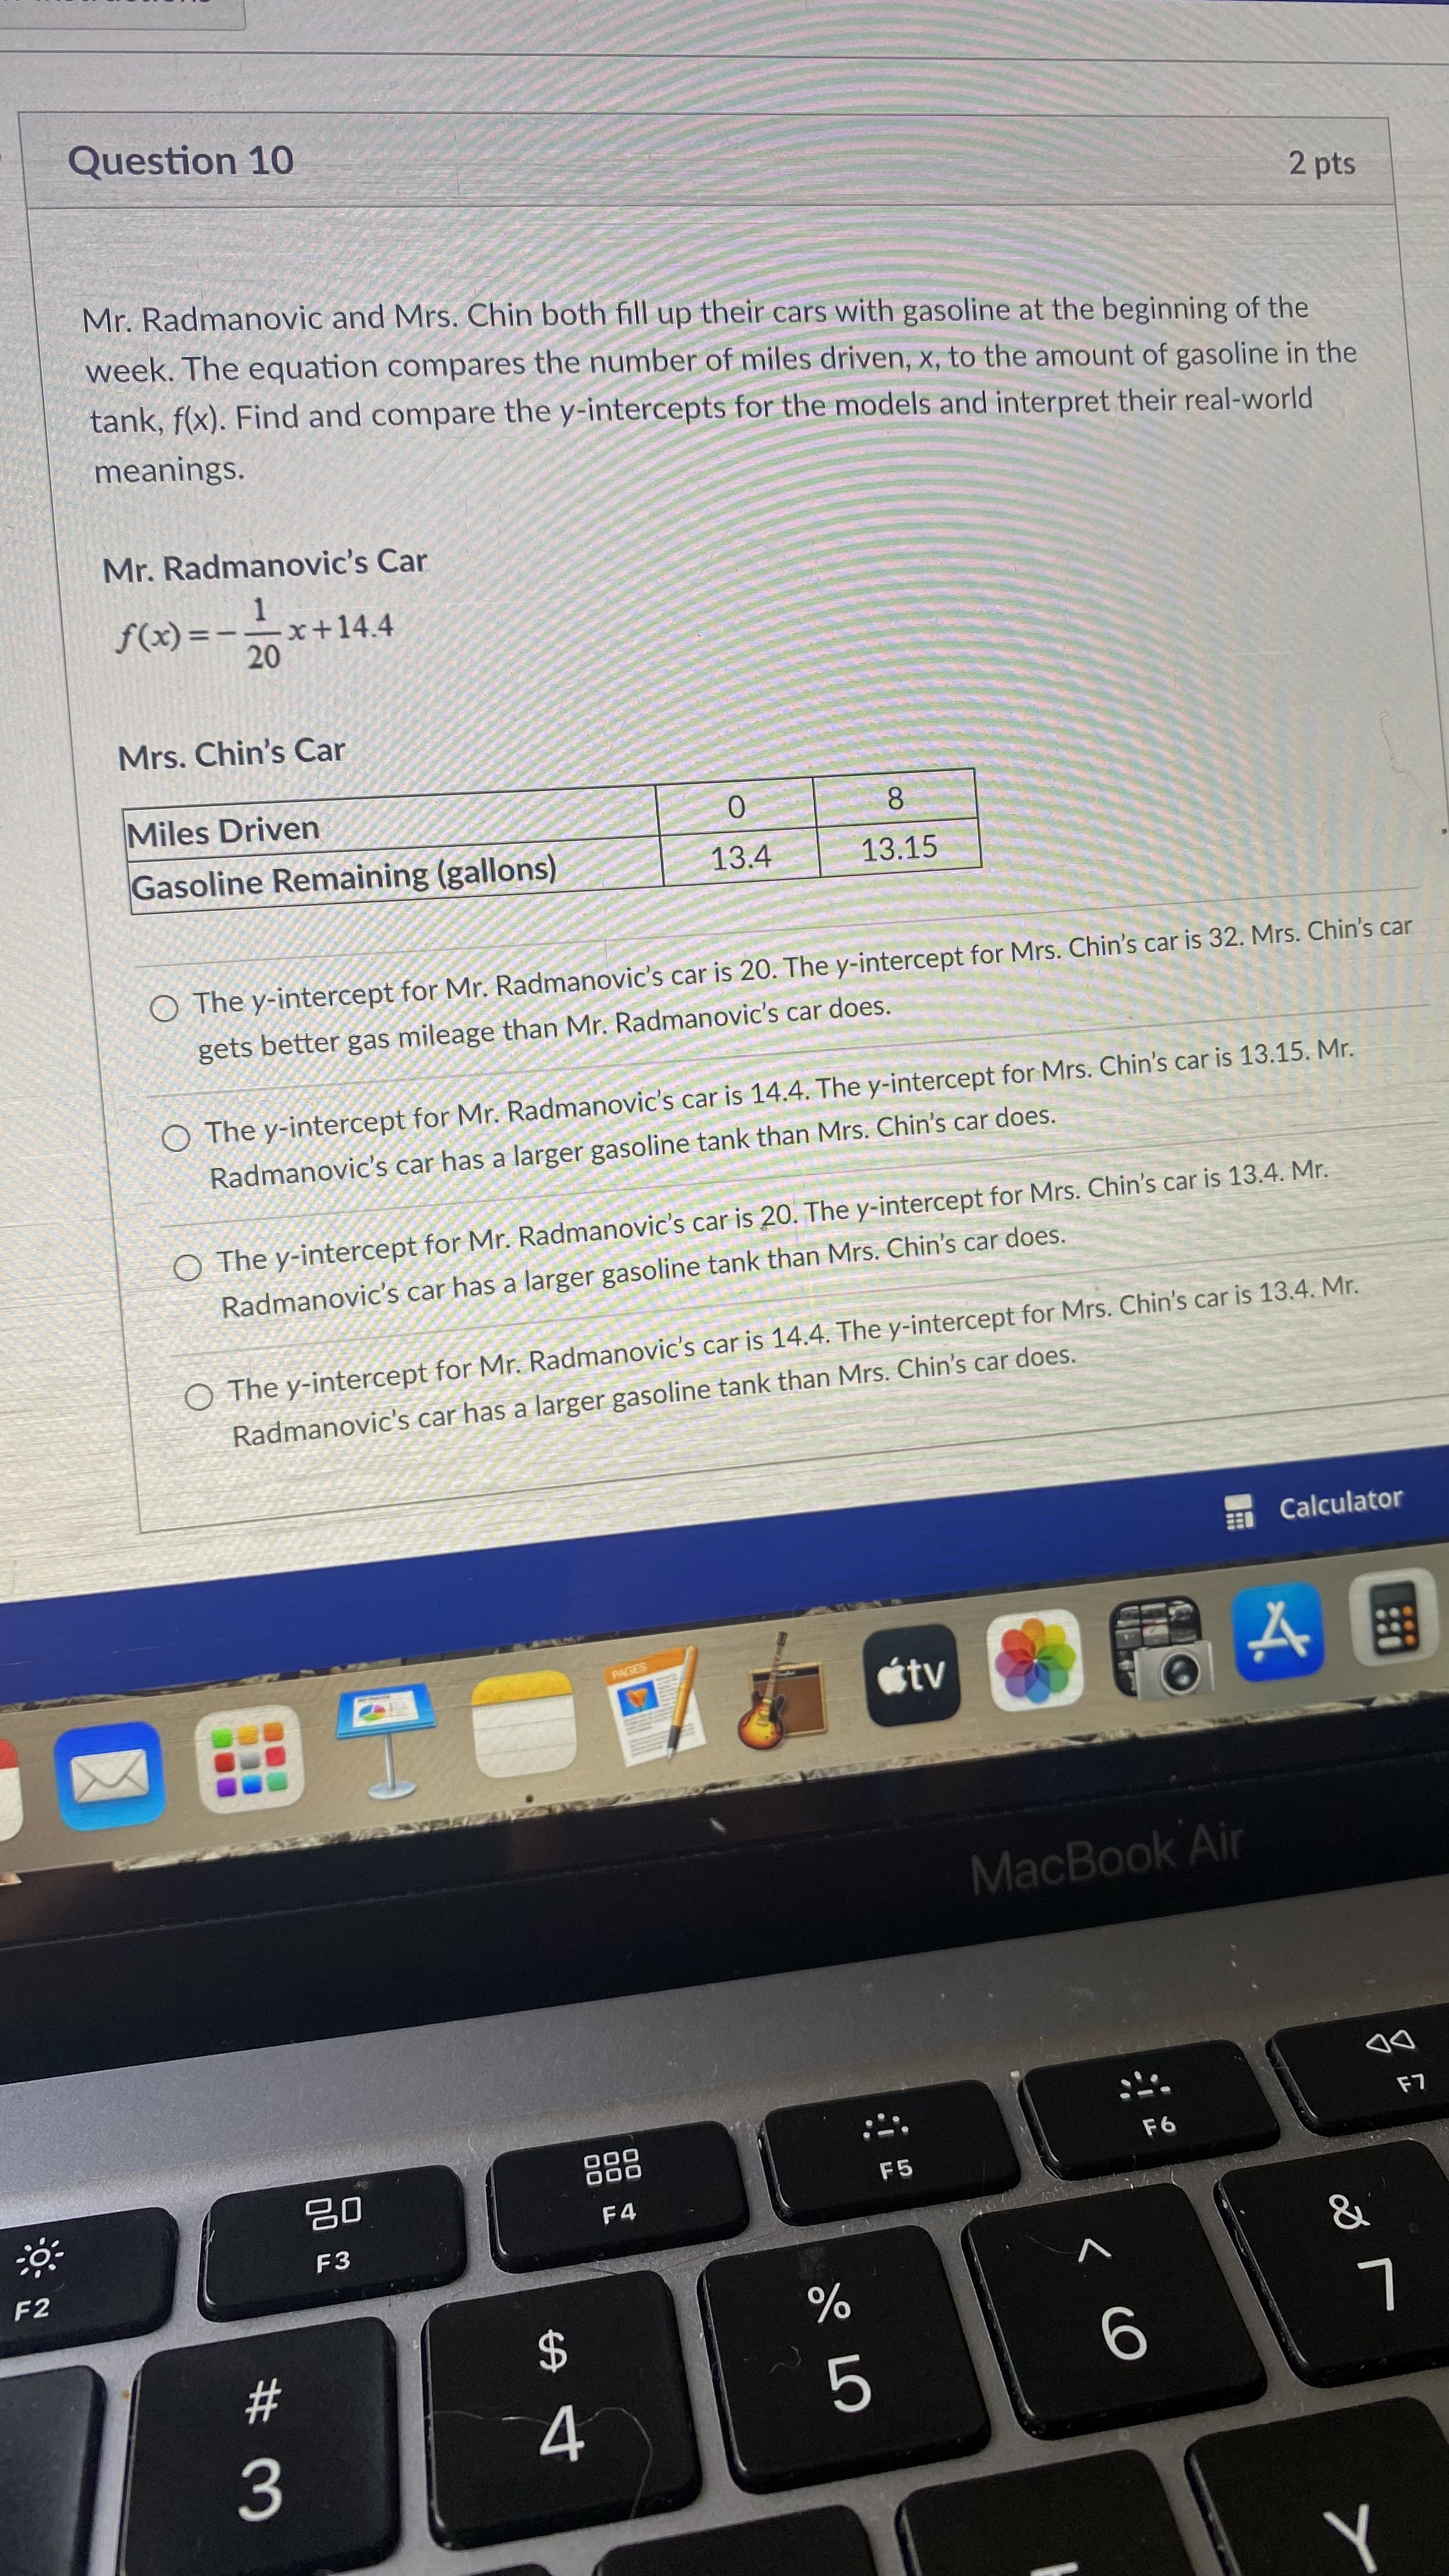
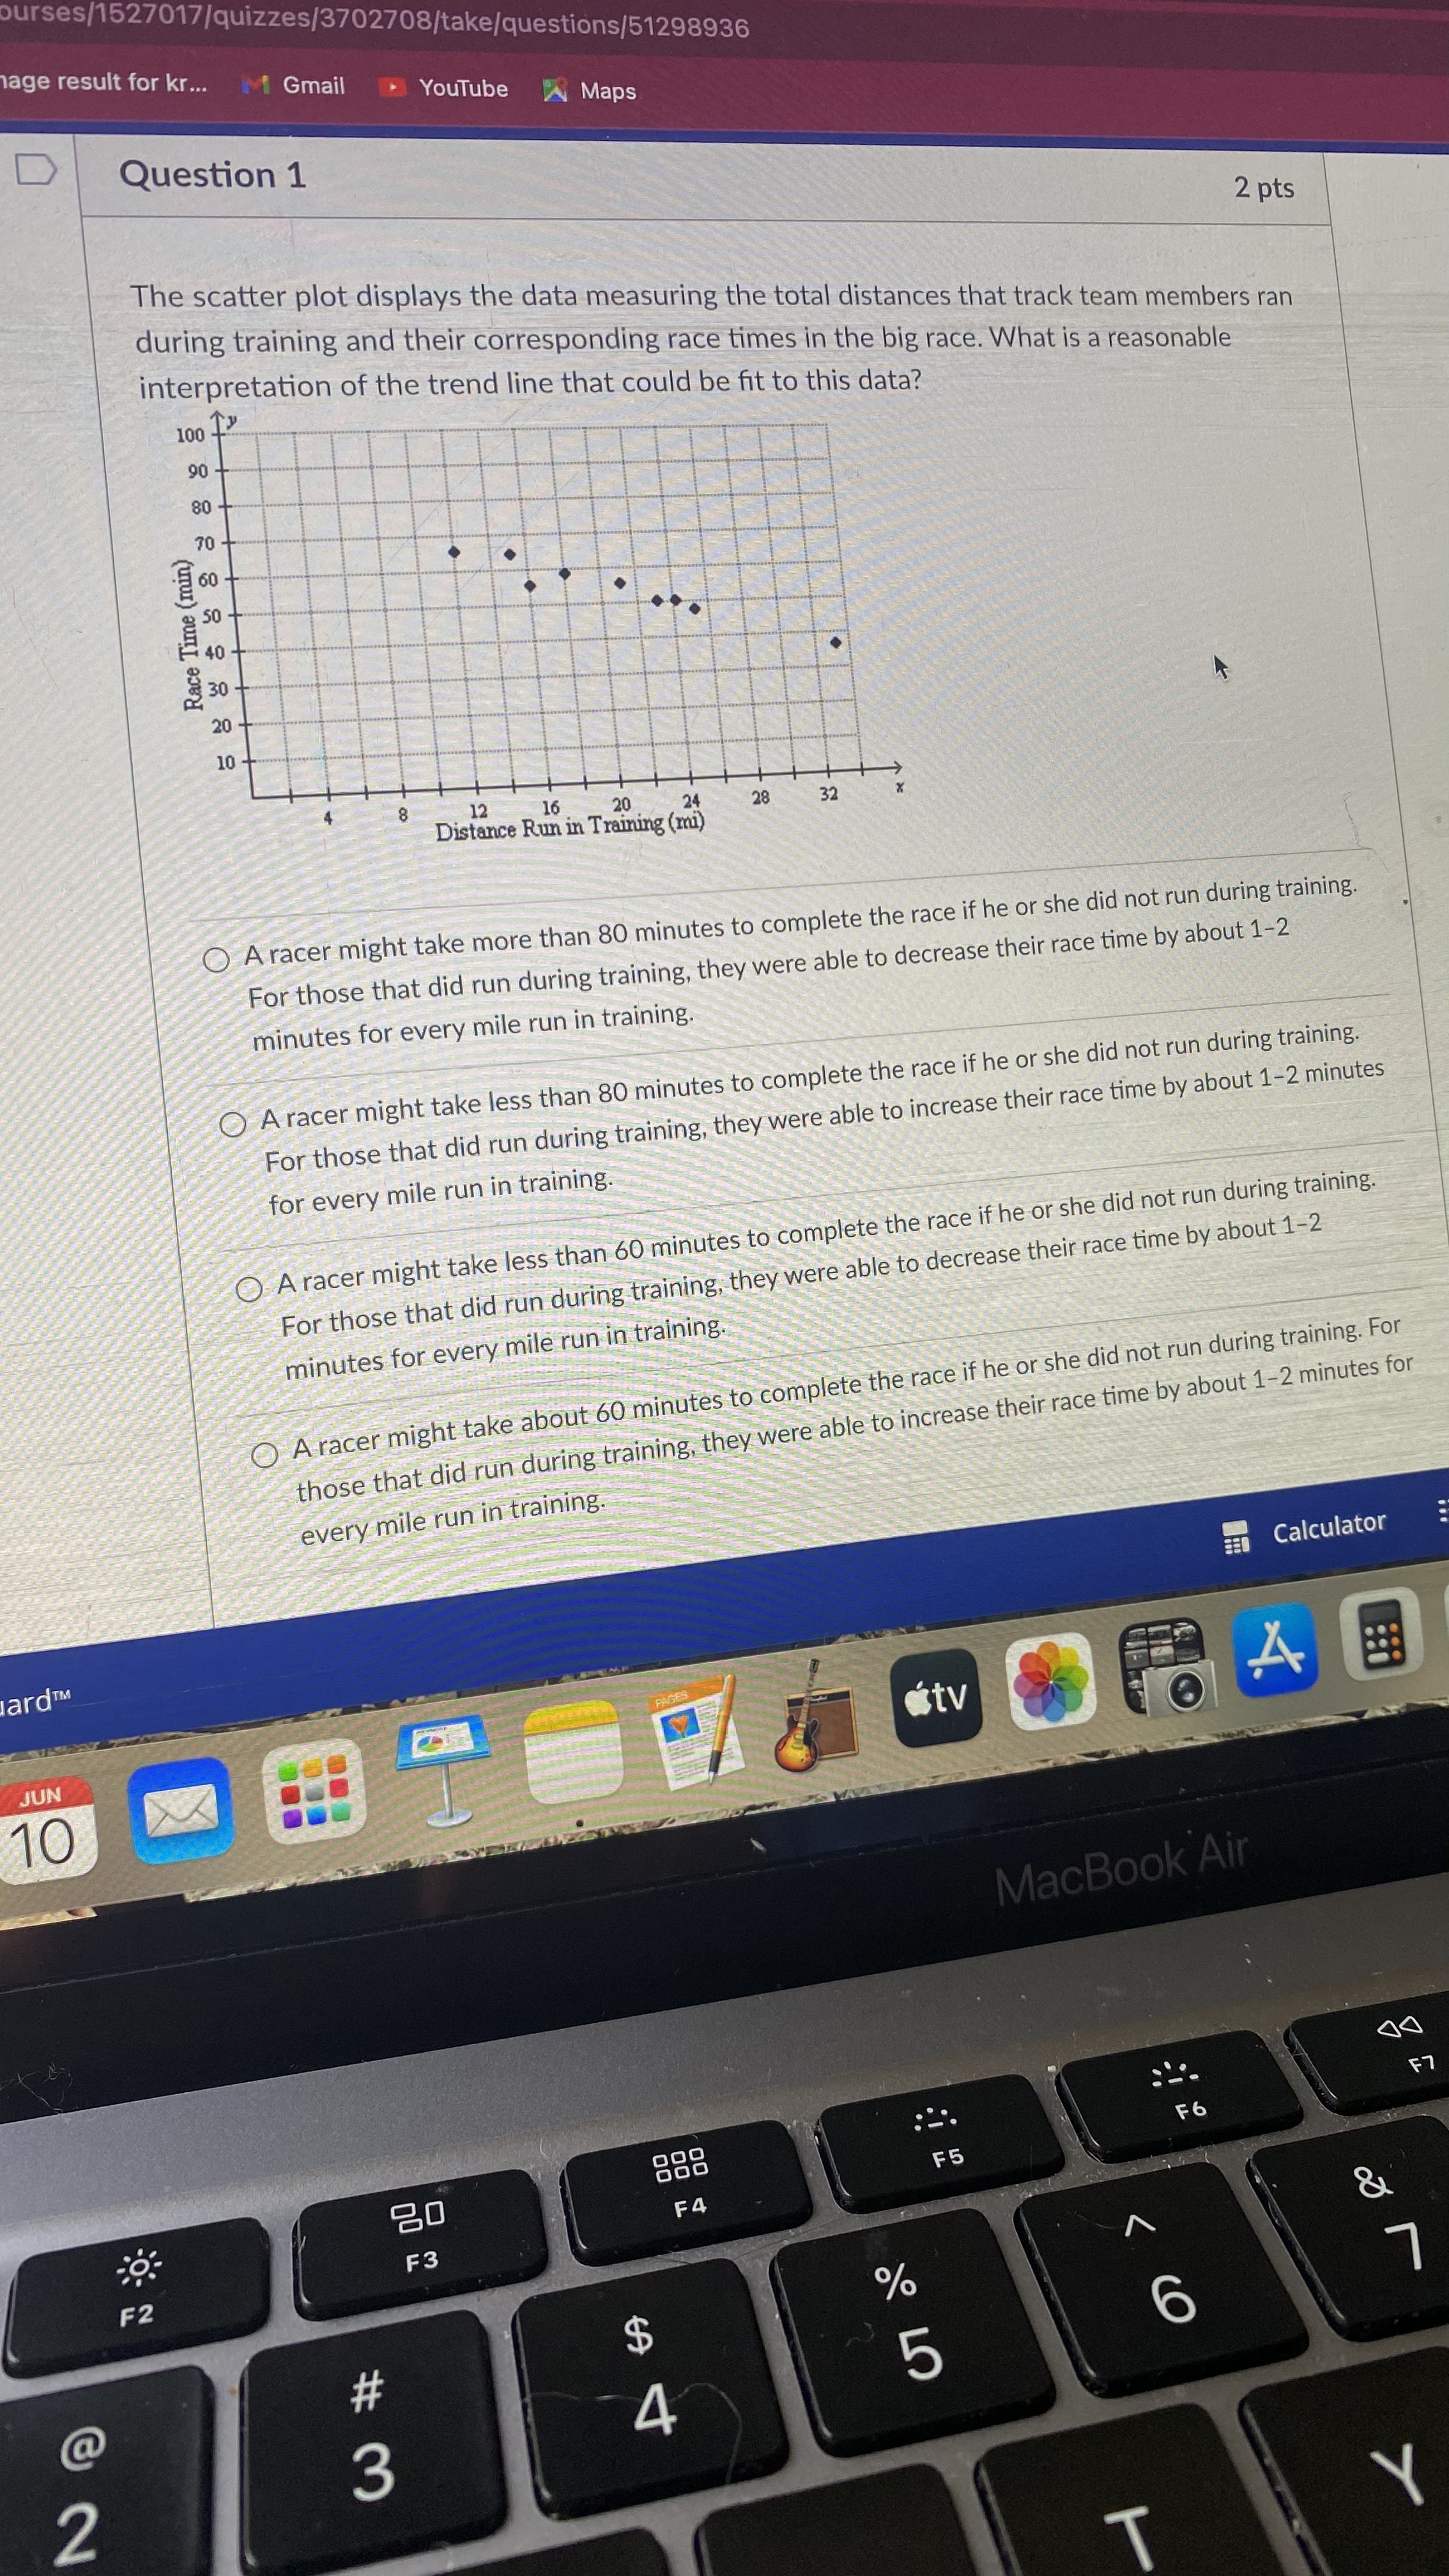
D Question 2 Which line best fits the data shown in the scatter plot? 8 fy 4 - 2. -8 -4 -2 2 4 6 * -2- 6- O y=0.5x+2 O y=-0.5x +2 O y=2x+0.5 O y=0.5x-2e result for kr.., I Gmail * YouTube A Maps 2 | Question 3 ~ The table compares the gas mileage to the distance the car can travel on one tank of gas. Make a scatter plot of the data. Then tell whether the data have a positive relation, a negative relation, or no relation. Gas Mileage (mi/gal) Distance (miles) 23 19 32 27 5 10 15 20 25. 30 35 Gas mileage (mi/gal) positive relationship __JLU /courses/1527017/quizzes/3702708/take/questions/51273973 Image result for kr... m Gmail YouTube Maps 300 200 - 100 10 15 20 25 30 35 Gas mileage (milgal) O positive relationship 300 - 600 500 Gas mileage (milgal) P400 300 200 100 10 15 20 25 30 35 Distance (mi) O no relationship 700 600 500 Distance (mi) 400 300 200 100 10 15 20 25 30 35 Gas mileage (mi/gal) positive relationship 700+ courses/1527017/quizzes/3702708/take/questions/51273973 mage result for kr... M Gmail YouTube Maps 100 10 15 20 25 30 35 Distance (mi) O no relationship 700 - 600 - soo+ Distance (mi) 400 300 200 100 5 10 15 20 25 30 35 Gas mileage (milgal) O positive relationship 700 - 600 500 Distance (mi) 400 300 200 100 10 15 20 25 30 35 Gas mileage (mi/gal) * Previous/questions/51273977 ge result for kr... I CGmail * YouTube M Maps 2 | Question 4 A travel agency surveys its customers to find out the average cost of a vacation compared the miles traveled during the vacation. The results of the survey are shown in the table. Us, the data to make a scatter plot.. e Miles Traveled Vacation Cost ' 500 200 300 400 100 Kog result for kr... Gmail YouTube P Maps 550 500 450 400 Vacation cost ($) 350 300 250 200 150 100 50 100 200 300 400 500 Miles traveled O $50 Vacation cost ($) 100 200 300 400 500 Miles traveled O Vacation cost ($) SO 100 200 300 400 500 Miles traveledses/1527017/quizzes/3702708/take/questions/51273972 result for kr... Gmail Youtube Maps 150 100 50 100 200 300 400 500 Miles traveled O Vacation cost ($) 100 200 300 400 500 Miles traveled O 585838388 Vacation cost ($) 100 50 100 200 300 400 500 Miles traveled PreviousQuestion 5 What type of relationship is shown by the scatter plot? negative relation O constant relation O no relation positive relation Previous PAGES V tv MacBook 000 20 F4 F5 N F3Question 6 What type of relation is shown? zero negative no correlation positive Previous PAGES N V tv MacBook 000 20 F5 F2 F3 F4Question 7 S The scatter plot shows the relationship between the weekly total sales ($) and the number of different rug designs a rug store has. Based on this relationship, predict what the total sales will be when the store has 110 different rug designs. 50000 40000 w o 2 o Total Sales (5) 2 g o 10000 100" 120 /140~ 160 2 23 60Numb$ of Designs O $35,000 O $31,000 O $0 O $38,000 - [ EICY 11z Instructions 10w Instructions \\ ' | 7| Question 8 S In the scatter plot, a line has been drawn to show the trend in a population of box turtles over a period of twelve months. Estimate the population of box turtles after 19 months. Box Turtle Population Turtles 540 turtles 210 turtles 90 turtles e O 150 turtles || (EICU w Instructions Question 9 2 pts Construct a scatter plot. Find the slope-intercept form of the equation of the line. X 1,000 100 2,000 400 6,000 50,800 9,000 2,028,800 8,000 621,800 9,000 808,200 5,000 9,500 9,000 2,298,700 3,000 600 1,000 100 8,000 660,800 3,000 700 9,000 1,069,400 10,000 2,705,200 500 400 300 y =0.037864x + 116.85 200 Calculator &tv A MacBook Air DD F7 889 20 F6 F5 F4 F3 F2 & $ % "> > 4 5 B Y\fQuestion 10 2 pts Mr. Radmanovic and Mrs. Chin both fill up their cars with gasoline at the beginning of the week. The equation compares the number of miles driven, x, to the amount of gasoline in the meanings. tank, f(x). Find and compare the y-intercepts for the models and interpret their real-world Mr. Radmanovic's Car f (x) = - x+14.4 20 Mrs. Chin's Car Miles Driven 0 8 Gasoline Remaining (gallons) 13.4 13.15 The y-intercept for Mr. Radmanovic's car is 20. The y-intercept for Mrs. Chin's car is 32. Mrs. Chin's car gets better gas mileage than Mr. Radmanovic's car does. The y-intercept for Mr. Radmanovic's car is 14.4. The y-intercept for Mrs. Chin's car is 13.15. Mr. Radmanovic's car has a larger gasoline tank than Mrs. Chin's car does. The y-intercept for Mr. Radmanovic's car is 20. The y-intercept for Mrs. Chin's car is 13.4. Mr. Radmanovic's car has a larger gasoline tank than Mrs. Chin's car does. O The y-intercept for Mr. Radmanovic's car is 14.4. The y-intercept for Mrs. Chin's car is 13.4. Mr. Radmanovic's car has a larger gasoline tank than Mrs. Chin's car does. Calculator AGES tv A MacBook Air DD F7 888 F6 20 F 5 F4 F3 F2 & % " > # $ 3 4 5 Ypurses/1527017/quizzes/3702708/take/questions/51298936 age result for kr... Gmail YouTube Maps D Question 1 2 pts The scatter plot displays the data measuring the total distances that track team members ran during training and their corresponding race times in the big race. What is a reasonable 100 interpretation of the trend line that could be fit to this data? 90 80 70 160 Race Time (min) 40 10 12 16 Distance Run in Training (mi) 20 24 28 32 A racer might take more than 80 minutes to complete the race if he or she did not run during training. For those that did run during training, they were able to decrease their race time by about 1-2 minutes for every mile run in training. A racer might take less than 80 minutes to complete the race if he or she did not run during training. For those that did run during training, they were able to increase their race time by about 1-2 minutes for every mile run in training. A racer might take less than 60 minutes to complete the race if he or she did not run during training. For those that did run during training, they were able to decrease their race time by about 1-2 minutes for every mile run in training. O A racer might take about 60 minutes to complete the race if he or she did not run during training. For those that did run during training, they were able to increase their race time by about 1-2 minutes for every mile run in training. Calculator ard TM JUN tv 10 MacBook Air F7 F6 20 F 5 F4 F3 F2 & % $ O > J 4 5 2 3 T Y
Step by Step Solution
There are 3 Steps involved in it

Get step-by-step solutions from verified subject matter experts