

Question: D Question 31 2.5 pts The table below shows quarterly sales and advertising expenditures for a multinational corporation over the last 11 quarters. Using these
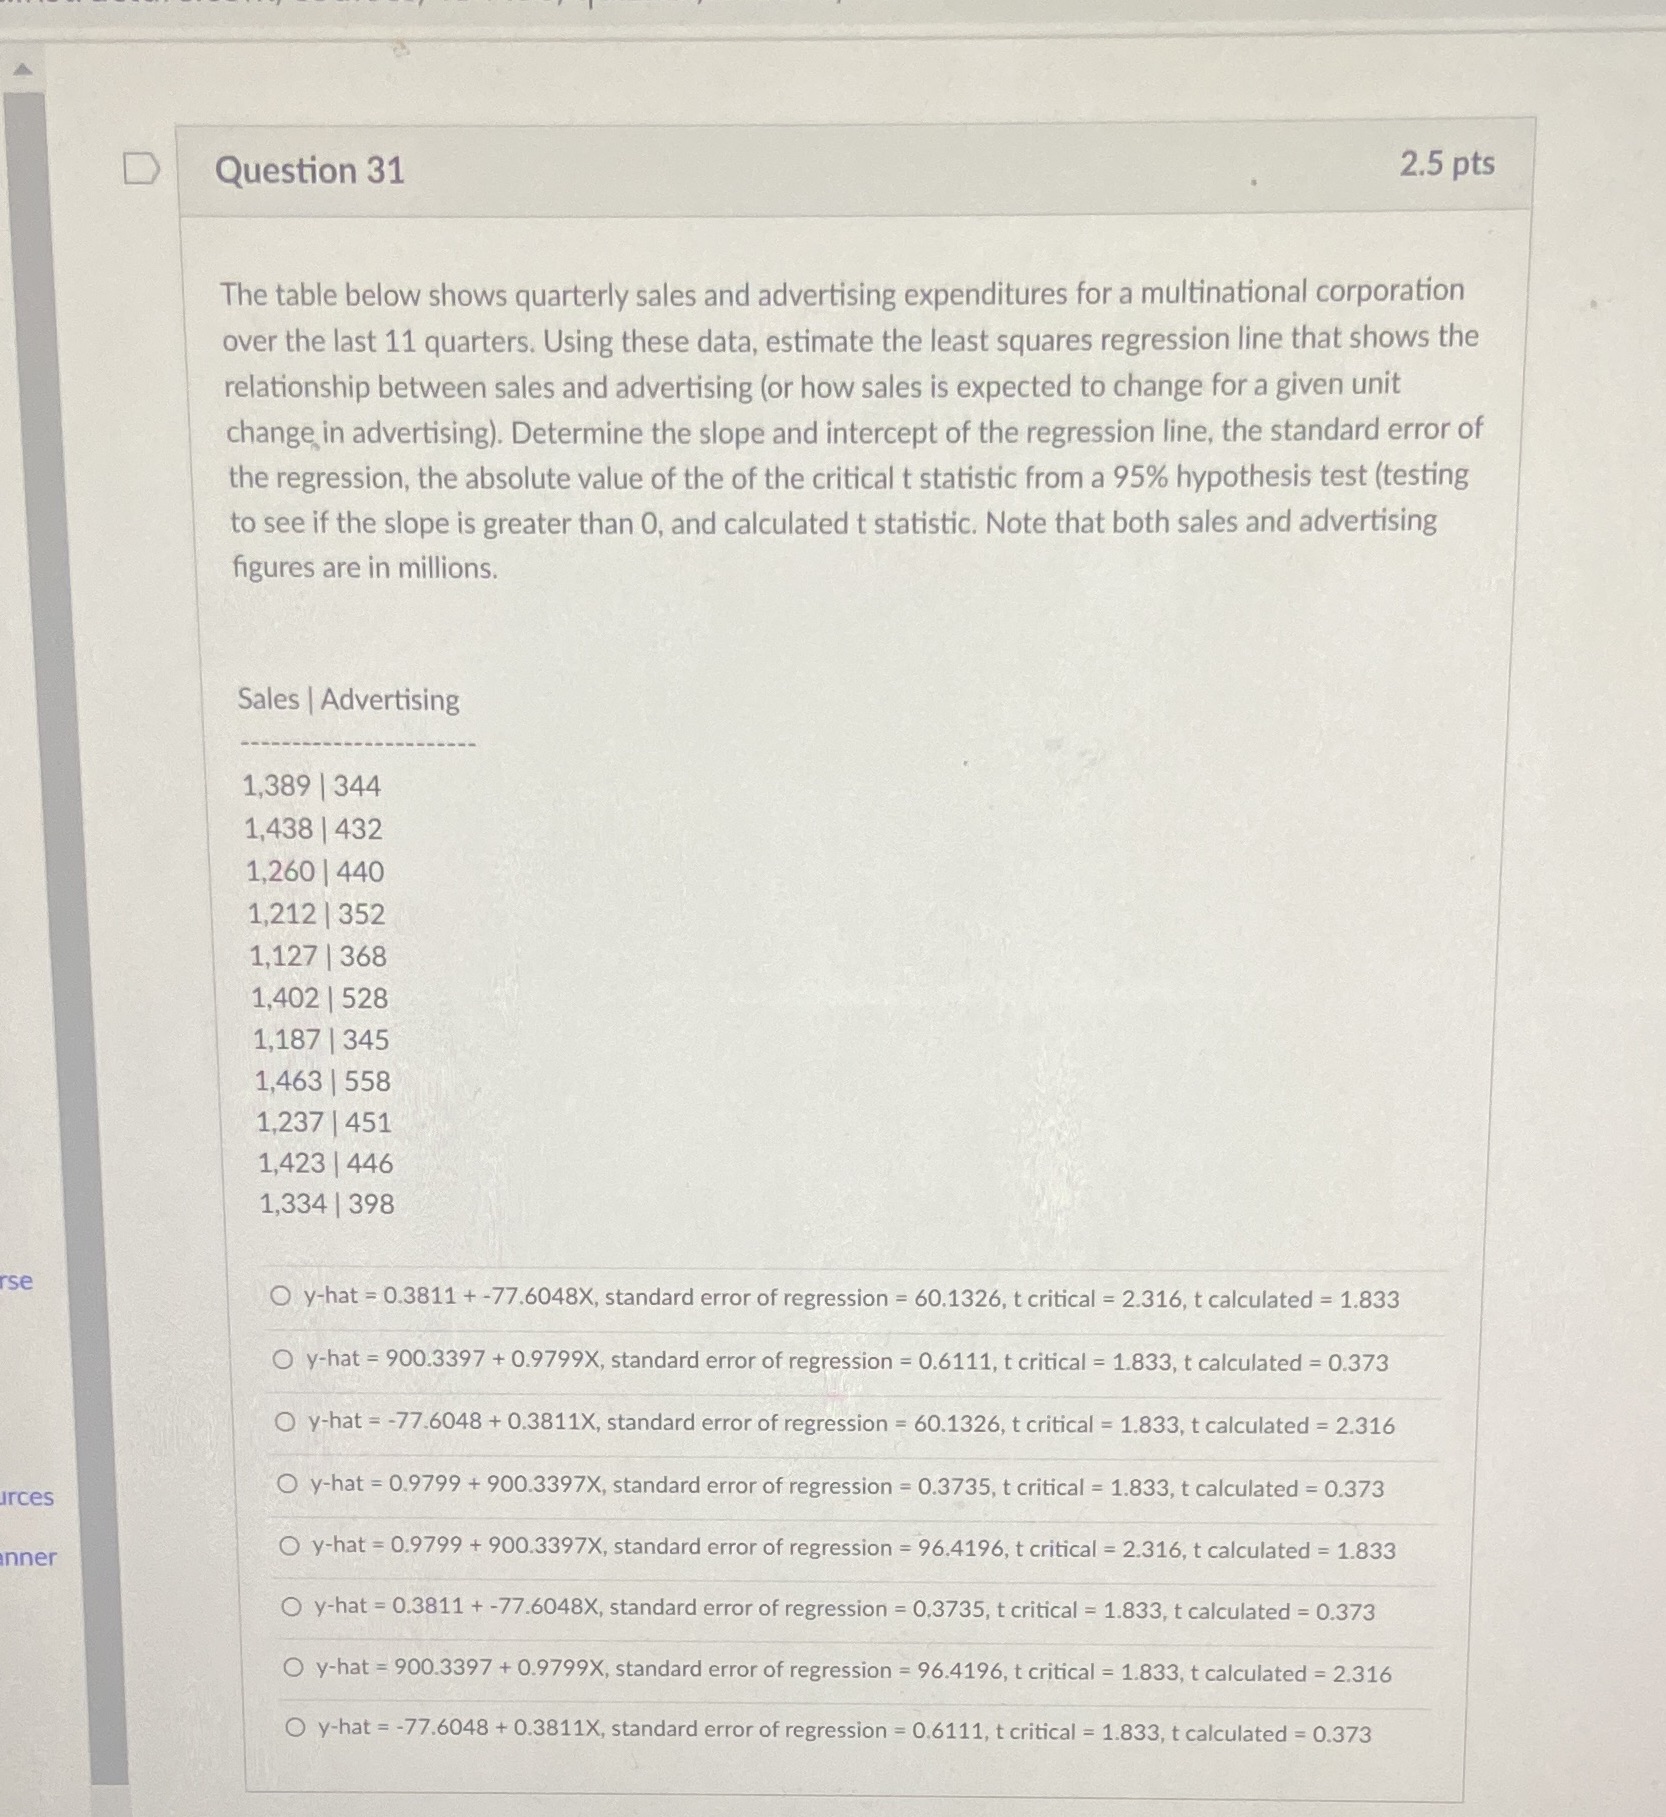
D Question 31 2.5 pts The table below shows quarterly sales and advertising expenditures for a multinational corporation over the last 11 quarters. Using these data, estimate the least squares regression line that shows the relationship between sales and advertising (or how sales is expected to change for a given unit change in advertising). Determine the slope and intercept of the regression line, the standard error of the regression, the absolute value of the of the critical t statistic from a 95% hypothesis test (testing to see if the slope is greater than 0, and calculated t statistic. Note that both sales and advertising figures are in millions. Sales | Advertising 1,389 | 344 1,438 | 432 1,260 | 440 1,212 | 352 1,127 | 368 1,402 | 528 1,187 | 345 1,463 | 558 1,237 | 451 1,423 | 446 1,334 | 398 O y-hat = 0.3811 + -77.6048X, standard error of regression = 60.1326, t critical = 2.316, t calculated = 1.833 O y-hat = 900.3397 + 0.9799X, standard error of regression = 0.6111, t critical = 1.833, t calculated = 0.373 O y-hat = -77.6048 + 0.3811X, standard error of regression = 60.1326, t critical = 1.833, t calculated = 2.316 urces O y-hat = 0.9799 + 900.3397X, standard error of regression = 0.3735, t critical = 1.833, t calculated = 0.373 Inner O y-hat = 0.9799 + 900.3397X, standard error of regression = 96.4196, t critical = 2.316, t calculated = 1.833 O y-hat = 0.3811 + -77.6048X, standard error of regression = 0.3735, t critical = 1.833, t calculated = 0.373 O y-hat = 900.3397 + 0.9799X, standard error of regression = 96.4196, t critical = 1.833, t calculated = 2.316 O y-hat = -77.6048 + 0.3811X, standard error of regression = 0.6111, t critical = 1.833, t calculated = 0.373
Step by Step Solution
There are 3 Steps involved in it

Get step-by-step solutions from verified subject matter experts