

Question: D Question 4 Consider the water use study again. There are four pairs of histograms below; the histograms within a pair are the same colour.
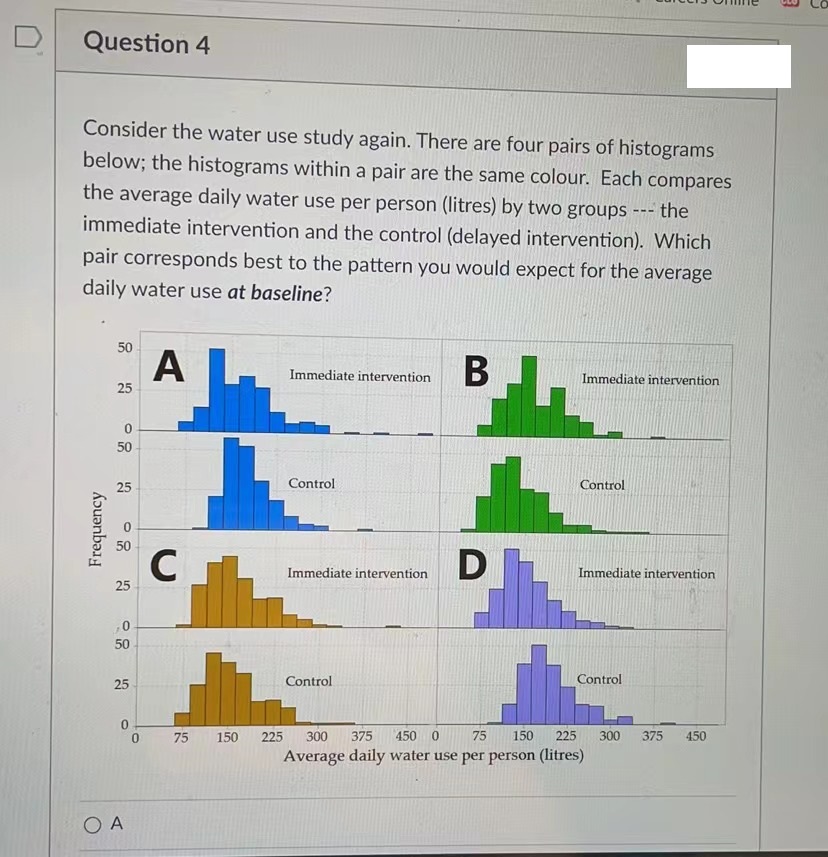

D Question 4 Consider the water use study again. There are four pairs of histograms below; the histograms within a pair are the same colour. Each compares the average daily water use per person (litres) by two groups --- the immediate intervention and the control (delayed intervention). Which pair corresponds best to the pattern you would expect for the average daily water use at baseline? 50 A Immediate intervention B Immediate intervention 25 0 50 Control Control 25 Frequency C Immediate intervention D Immediate intervention 25 50 Control Control 25 150 225 300 375 450 0 75 150 225 300 375 450 75 Average daily water use per person (litres) OA
Step by Step Solution
There are 3 Steps involved in it

Get step-by-step solutions from verified subject matter experts