

Question: D Question 5 2 pts Shoe size data, collected at the beginning of the semester, can be separated according to gender. Let the WCU female
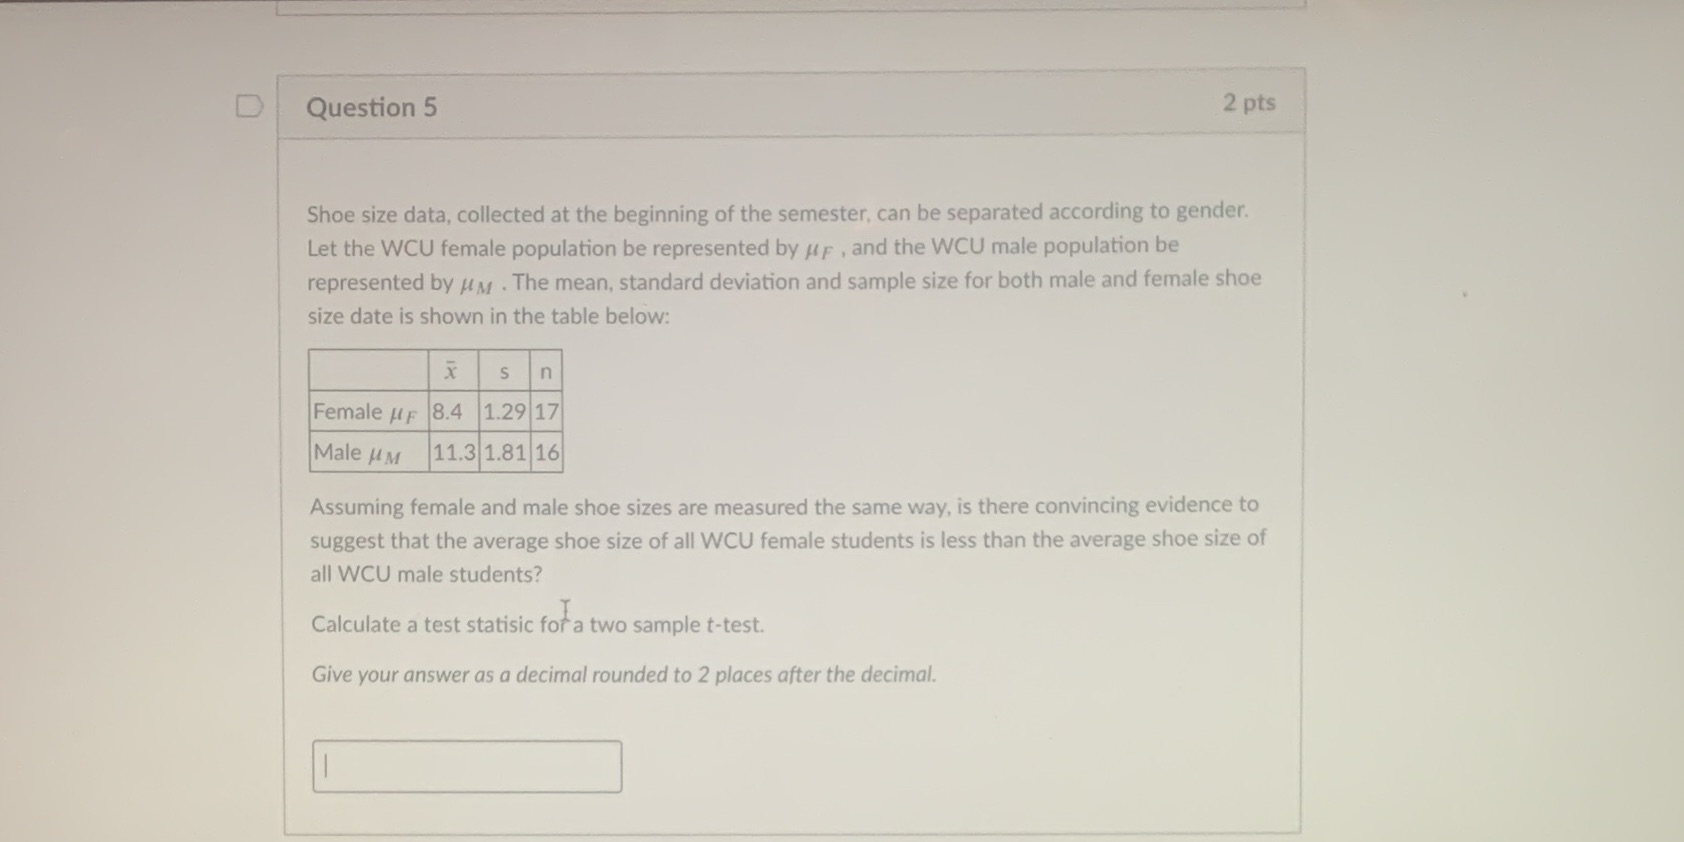
D Question 5 2 pts Shoe size data, collected at the beginning of the semester, can be separated according to gender. Let the WCU female population be represented by /F , and the WCU male population be represented by MM . The mean, standard deviation and sample size for both male and female shoe size date is shown in the table below: X S Female HF 8.4 1.29 17 Male UM 11.3 1.81 16 Assuming female and male shoe sizes are measured the same way, is there convincing evidence to suggest that the average shoe size of all WCU female students is less than the average shoe size of all WCU male students? Calculate a test statisic for a two sample t-test. Give your answer as a decimal rounded to 2 places after the decimal
Step by Step Solution
There are 3 Steps involved in it

Get step-by-step solutions from verified subject matter experts