

Question: D Question 7 2 pts Using Table 1, calculate percent change in aggregate retail fresh vegetable disappearance (consumption) from 2010 to 2015. Enter your answer
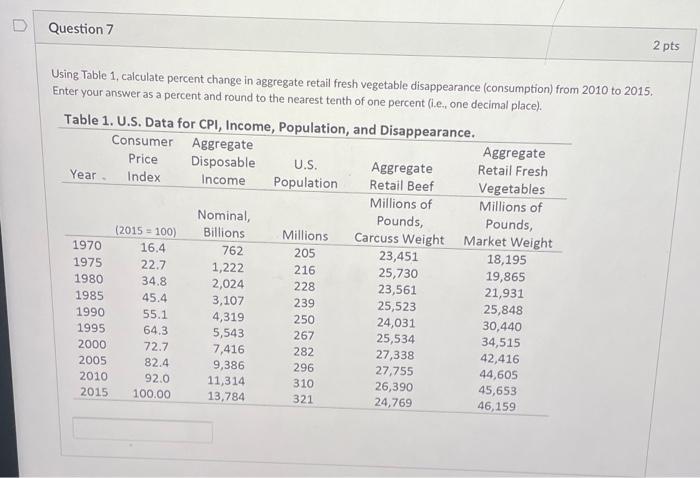
D Question 7 2 pts Using Table 1, calculate percent change in aggregate retail fresh vegetable disappearance (consumption) from 2010 to 2015. Enter your answer as a percent and round to the nearest tenth of one percent (i.e, one decimal place). Table 1. U.S. Data for CPI,Income, Population, and Disappearance. Consumer Aggregate Aggregate Price Disposable U.S. Aggregate Retail Fresh Year. Index Income Population Retail Beef Vegetables Millions of Millions of Nominal, Pounds, Pounds, (2015 - 100) Billions Millions Carcuss Weight Market Weight 1970 16.4 762 205 23,451 18,195 1975 22.7 1,222 216 25,730 19,865 1980 34.8 2,024 228 23,561 21,931 1985 45.4 3,107 239 25,523 25,848 1990 55.1 4,319 250 24,031 30,440 1995 64.3 5,543 267 25,534 34,515 2000 72.7 7,416 282 27,338 42,416 2005 82.4 9,386 296 27,755 44,605 2010 92.0 11,314 310 26,390 45,653 2015 100.00 13,784 321 24,769 46,159
Step by Step Solution
There are 3 Steps involved in it

Get step-by-step solutions from verified subject matter experts