

Question: D Question 8 2 pts The sampling distribution below shows means from samples of size n = 30. 25 45 65 85 105 125 145
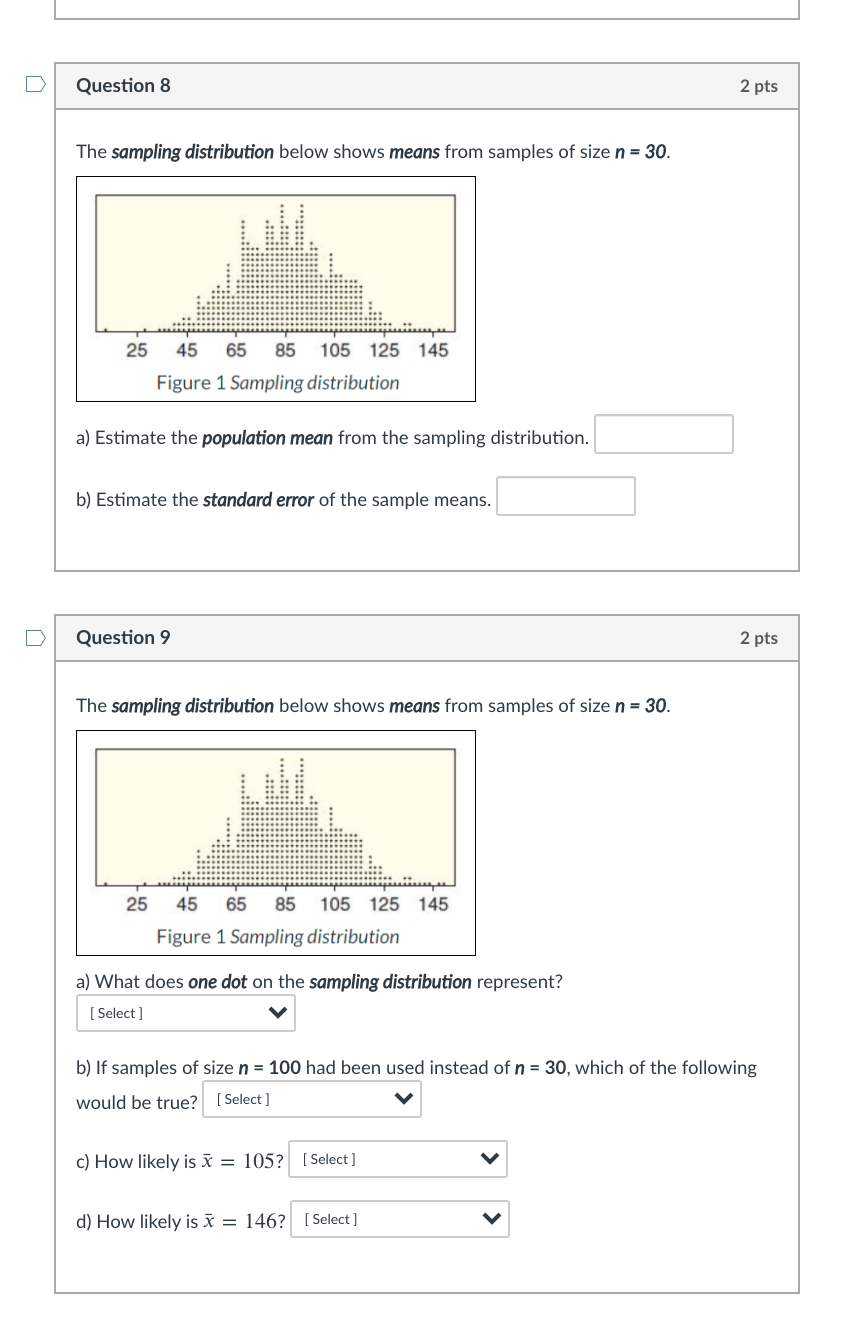
D Question 8 2 pts The sampling distribution below shows means from samples of size n = 30. 25 45 65 85 105 125 145 Figure 1 Sampling distribution a) Estimate the population mean from the sampling distribution. b) Estimate the standard error of the sample means. D Question 9 2 pts The sampling distribution below shows means from samples of size n = 30. 25 45 65 85 105 125 145 Figure 1 Sampling distribution a) What does one dot on the sampling distribution represent? [ Select ] b) If samples of size n = 100 had been used instead of n = 30, which of the following would be true? [ Select ] c) How likely is x = 105? [Select ] d) How likely is x = 146? [ Select ]
Step by Step Solution
There are 3 Steps involved in it

Get step-by-step solutions from verified subject matter experts