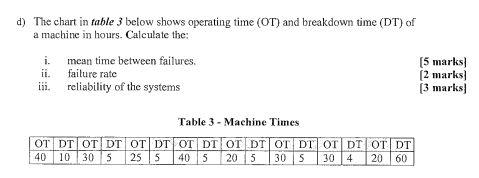
Question: d) The chart in table 3 below shows operating time (OT) and breakdown time (DT) of a machine in hours. Calculate the: i. mean time

d) The chart in table 3 below shows operating

d) The chart in table 3 below shows operating time (OT) and breakdown time (DT) of a machine in hours. Calculate the: i. mean time between failures. ii. failure rate i. reliability of the systems (5 marks [2 marks [3 marks) Table 3 - Machine Times OT DT OT DT OT DT OT DTOT DTOT DTOT DTOT DT 40 10 30 5 255 40 5 20 5 30 S 304 20 60

Step by Step Solution

There are 3 Steps involved in it

1 Expert Approved Answer
Step: 1 Unlock blur-text-image
Question Has Been Solved by an Expert!

Get step-by-step solutions from verified subject matter experts

Step: 2 Unlock
Step: 3 Unlock

Students Have Also Explored These Related General Management Questions!