

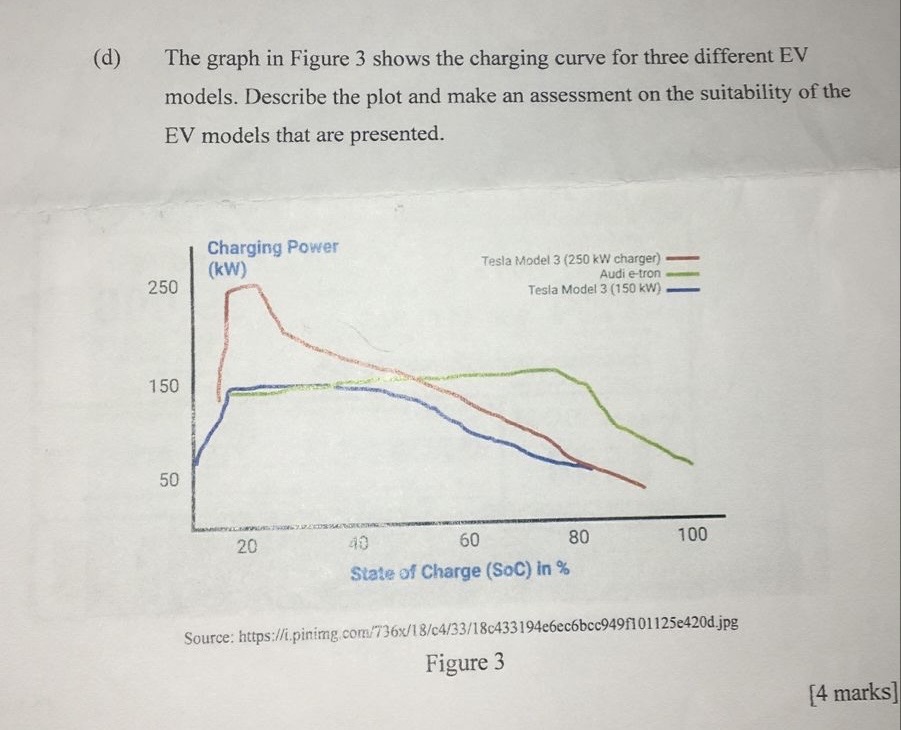
Question: ( d ) The graph in Figure 3 shows the charging curve for three different EV models. Describe the plot and make an assessment on
d The graph in Figure shows the charging curve for three different EV models. Describe the plot and make an assessment on the suitability of the EV models that are presented.
Charcina Power
Step by Step Solution
There are 3 Steps involved in it
1 Expert Approved Answer
Step: 1 Unlock

Question Has Been Solved by an Expert!
Get step-by-step solutions from verified subject matter experts
Step: 2 Unlock
Step: 3 Unlock