

Question: d. The table includes data on the valueadded per worker, in thousands of dollars, in each sector in both countries for 2018. Fill in the


![in industry: $ C] Valueaddedlworker for Thailand in service: $ Cl Who](https://s3.amazonaws.com/si.experts.images/answers/2024/06/667c691cf313c_404667c691cc8e39.jpg)
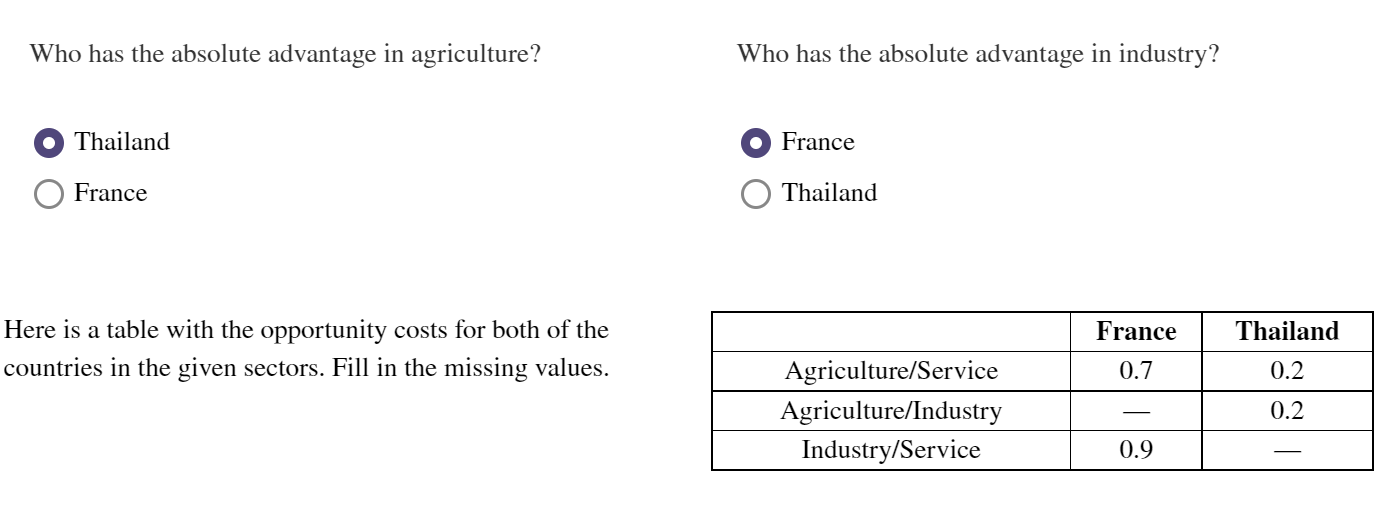
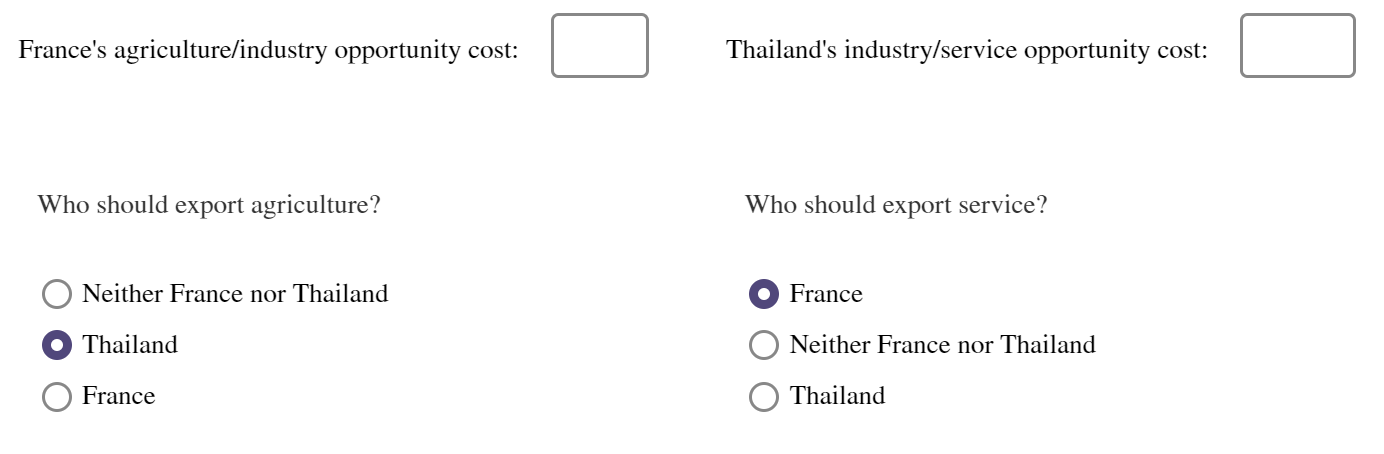


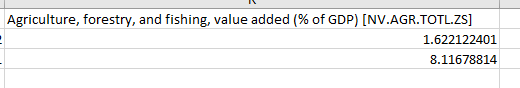
d. The table includes data on the valueadded per worker, in thousands of dollars, in each sector in both countries for 2018. Fill in the missing values. Then, determine who has the absolute advantage and comparative advantage in which industry. Round answers to one place aer the decimal where necessary. Value-added per worker Value-added per worker Value-added per worker Agriculture Industry Service France 55.5 83.1 Thailan- 3.3 19.9 Valueadded/worker for France in industry: $ C] Valueaddedlworker for Thailand in service: $ Cl Who has the absolute advantage in agriculture? Who has the absolute advantage in industry? Thailand France O France O Thailand Here is a table with the opportunity costs for both of the France Thailand countries in the given sectors. Fill in the missing values. Agriculture/Service 0.7 0.2 Agriculture/Industry 0.2 Industry/Service 0.9France's agriculture/industry opportunity cost: Thailand's industry/service opportunity cost: Who should export agriculture? Who should export service? ONeither France nor Thailand France Thailand Neither France nor Thailand France ThailandD Time Time Code CountryT Country CcLabor force participation rate, male (% of male population ages 15+) (modeled ILO estimate) [SL.TLF.CACT.MA.ZS] Labor force participation rate, female (% of female population ages 15+) (modeled ILO estimate) [SL.TLF.CACT.FE.ZS] $3 2018 YR2018 France FRA 60.20999908 50.83800125 39 2018 YR2018 Thailand THA 76.33999634 59.45600128G H 1 Labor force, total [SL.TLF.TOTL.IN] Labor force, female (% of total labor force) [SL.TLF.TOTL.FE.ZS] Employment in agriculture, female (% of female employment) (modeled ILO estimate) [SL.AGR.EMPL.FE.ZS] 33 30396906 47.95413717 1.394000053 39 38907795 45.59004693 29.1849994K 1 Employment in agriculture, male (% of male employment) (modeled ILO estimate) [SL.AGR.EMPL.MA.ZS] Employment in industry, female (% of female employment) (modeled ILO estimate) [SL.IND.EMPL.FE.ZS] 3.535000086 9.640000343 39 34.61000061 19.9659996Employment in industry, male (% of male employment) (modeled ILO estimate) [SL.IND.EMPL.MA.ZS] 3 Employment in services, female (% of female employment) (modeled ILO estimate) [SL.SRV.EMPL.FE.ZS] 30.10300064 39 88.96600342 25.18400002 50.84899907O Q Employment in services, male (% of male employment) (modeled ILO estimate) [SL.SRV.EMPL.MA.ZS] Services, value added (% of GDP) [NV.SRV.TOTL.ZS] Industry (including construction), value added (% of GDP) [NV.IND. TOTL.ZS] GDP (current US$) [NY.GDP.MKTP.CD] 66.36199951 70.33861858 16.8979512 2.77754E+12 40.20600128 56.90849897 34.97471289 5.04993E+11Agriculture, forestry, and fishing, value added (% of GDP) [NV.AGR.TOTL.ZS] 1.622122401 8.11678814
Step by Step Solution
There are 3 Steps involved in it

Get step-by-step solutions from verified subject matter experts