

Question: (d) Use Matlab to plot a single graph containing the voltage waveform, and the two current waveforms, 11 and 12 against time over one cycle

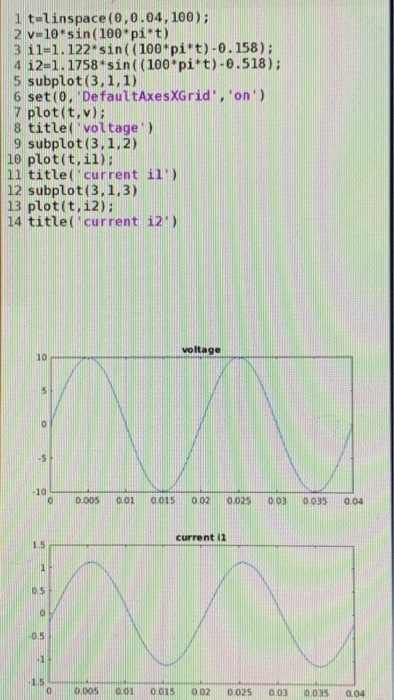
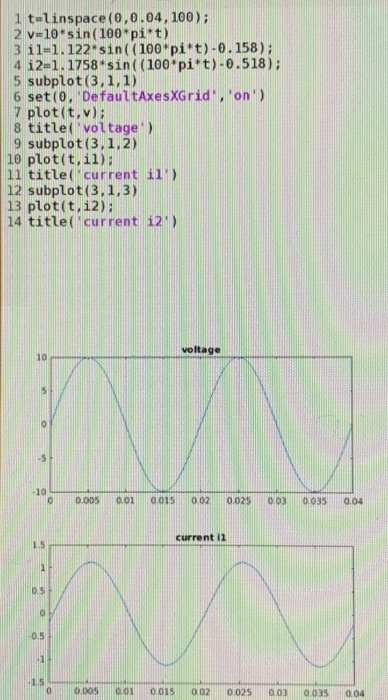
(d) Use Matlab to plot a single graph containing the voltage waveform, and the two current waveforms, 11 and 12 against time over one cycle of the supply voltage. You should label and scale the graph appropriately. Place your graph in the 1 t-linspace(0,0.04, 100); 2 v=10-sin(100 pi*t) 3 il=1.122.sin((100 pi*t)-0.158); 4 i2=1.1758 sin((100*pi*t)-0.518): 5 subplot(3,1,1) 6 set(0, 'DefaultAxesXGrid', 'on') 7 plot(t,v); 8 title voltage 9 subplot(3,1,2) 10 plot(t,il): 11 title( current il ) 12 subplot(3,1,3) 13 plot(t, i2); 14 title(current 12) voltage 0.00 0.01 0015002 0.025 0. 0 0035 0.04 current 11 1005 001 001 002 0025 0. 0 0035 0.04 1 t-linspace(0,0.04, 100); 2 v=10*sin(100*pi*t) 3 il=1.122 sin((100*pi*t)-0.158); 4 i2=1.1758*sin((100*pi't) -0.518): 5 subplot(3,1,1) 6 set(0, 'DefaultAxes XGrid', 'on') 7 plot(t,v); 8 title voltage 9 subplot(3,1,2) 10 plot(t, il); 11 title( current il ) 12 subplot(3, 1,3) 13 plot(t, i2); 14 title( current 12) voltage 0.00 0.01 0.015002 0.025 0. 0 0035 0.04 0.00 0015002 0.025 0.0 0.035 0.04
Step by Step Solution
There are 3 Steps involved in it

Get step-by-step solutions from verified subject matter experts