

Question: d) Using the data from parts a) through c), provide an analysis of each race based on your results (i.e. how do the speed and
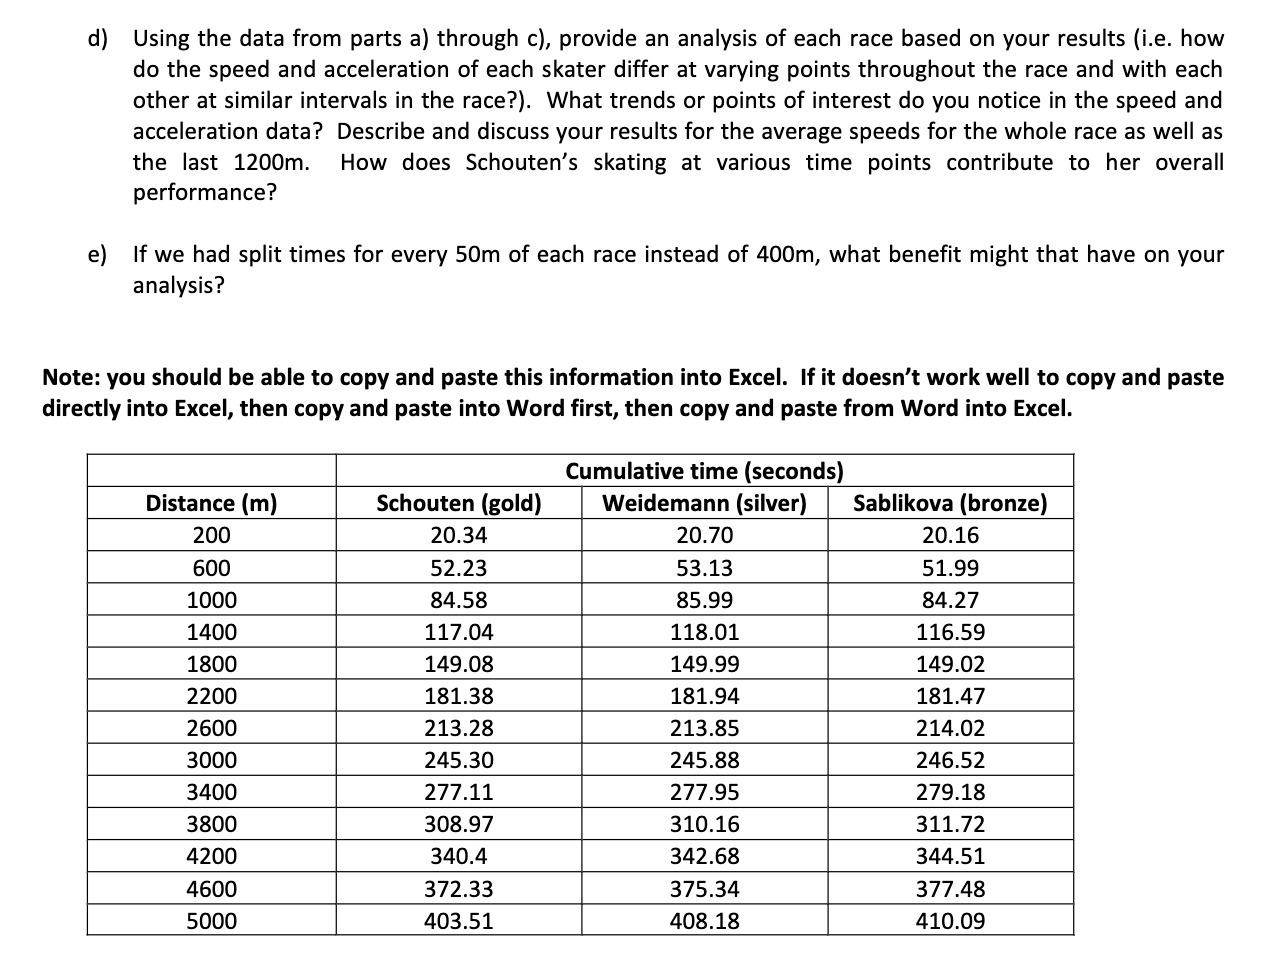
d) Using the data from parts a) through c), provide an analysis of each race based on your results (i.e. how do the speed and acceleration of each skater differ at varying points throughout the race and with each other at similar intervals in the race?). What trends or points of interest do you notice in the speed and acceleration data? Describe and discuss your results for the average speeds for the whole race as well as the last 1200m. How does Schouten's skating at various time points contribute to her overall performance? e) If we had split times for every 50m of each race instead of 400m, what benefit might that have on your analysis? Note: you should be able to copy and paste this information into Excel. If it doesn't work well to copy and paste directly into Excel, then copy and paste into Word first, then copy and paste from Word into Excel. Cumulative time (seconds) Distance (m) Schouten (gold) Weidemann (silver) Sablikova (bronze) 200 20.34 20.70 20.16 600 52.23 53.13 51.99 1000 1400 1800 2200 2600 3000 3400 3800 4200 4600 5000
Step by Step Solution
There are 3 Steps involved in it

Get step-by-step solutions from verified subject matter experts