

Question: D Which of the three 7-statistics indicates that the sample mean is farthest away from the population mean? E Which of the three T-statistics indicate

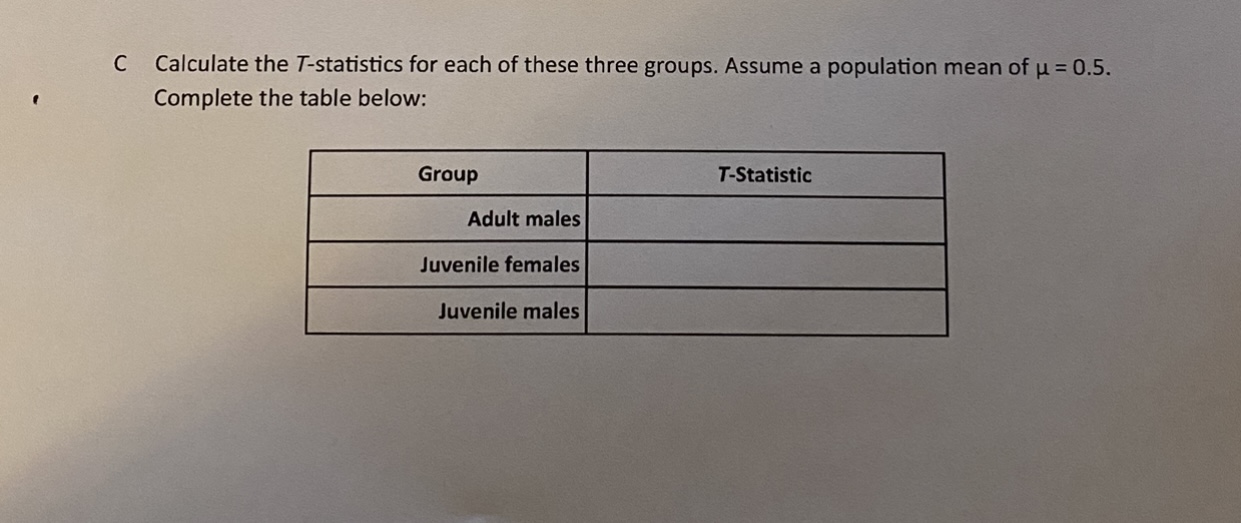


D Which of the three 7-statistics indicates that the sample mean is farthest away from the population mean? E Which of the three T-statistics indicate that the sample means are below the population mean? F Which of the three 7-statistics indicates that the sample mean is closest to the population mean? 3. Think about the sample statistics for all four samples. Which group of snakes appears to most favor left-handed coiling? Which group appears to most favor right-handed coiling?C Calculate the 7-statistics for each of these three groups. Assume a population mean of u = 0.5. Complete the table below: Group T-Statistic Adult males Juvenile females Juvenile males
Step by Step Solution
There are 3 Steps involved in it

Get step-by-step solutions from verified subject matter experts