Question: D15-48. Interpreting Analysts Reports that Use Valuation with Multiples Refer to the following excerpts from an analysts' report (13 pages total) covering Marriott Interna- tional
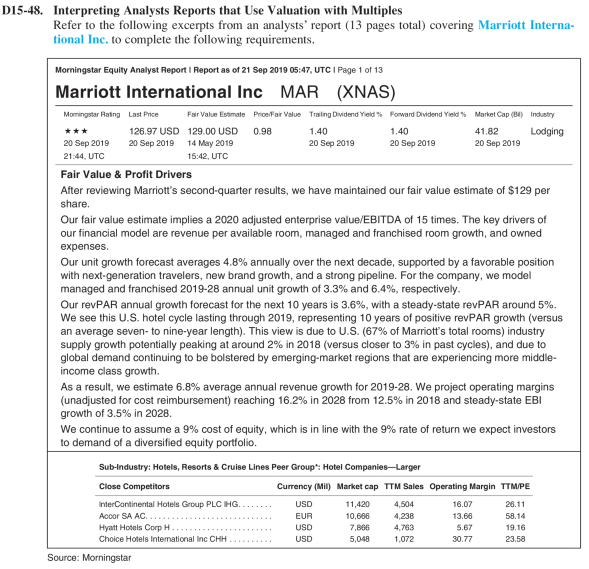
D15-48. Interpreting Analysts Reports that Use Valuation with Multiples Refer to the following excerpts from an analysts' report (13 pages total) covering Marriott Interna- tional Inc. to complete the following requirements. Morningstar Equity Analyst Report I Report as of 21 Sep 2019 05:47, UTC I Page 1 of 13 Marriott International Inc MAR (XNAS) Morningstar Plating Last Price Fair Value Estimate Price Fair Value Trailing Dividend Yield %% Forward Dividend Yield % Market Cap (Di) Industry 126.97 USD 129.00 USD 0.98 1.40 1.40 41.82 Lodging 20 Sep 2018 20 Sep 2018 14 May 2018 20 Sep 2019 20 Sep 2019 20 Sep 2019 21:44. UTC 15:42, UTC Fair Value & Profit Drivers After reviewing Marriott's second-quarter results, we have maintained our fair value estimate of $129 per share. Our fair value estimate implies a 2020 adjusted enterprise value/EBITDA of 15 times. The key drivers of our financial model are revenue per available room, managed and franchised room growth, and owned expenses. Our unit growth forecast averages 4.8% annually over the next decade, supported by a favorable position with next-generation travelers, new brand growth, and a strong pipeline. For the company, we model managed and franchised 2019-28 annual unit growth of 3.3% and 6.4%, respectively. Our revPAR annual growth forecast for the next 10 years is 3.6%, with a steady-state revPAR around 5%. We see this U.S. hotel cycle lasting through 2019, representing 10 years of positive revPAR growth (versus an average seven- to nine-year length). This view is due to U.S. (67% of Marriott's total rooms) industry supply growth potentially peaking at around 2% in 2018 (versus closer to 3% in past cycles), and due to global demand continuing to be bolstered by emerging-market regions that are experiencing more middle- income class growth. As a result, we estimate 6.8% average annual revenue growth for 2019-28. We project operating margins (unadjusted for cost reimbursement) reaching 16.2% in 2028 from 12.5% in 2018 and steady-state EBI growth of 3.5% in 2028 We continue to assume a 9% cost of equity, which is in line with the 9% rate of return we expect investors to demand of a diversified equity portfolio. Sub-Industry: Hotels, Resorts & Cruise Lines Peer Group": Hotel Companies-Larger Close Competitors Currency (Mil) Market cap TIM Sales Operating Margin TTM/PE InterContinental Hotels Group PLC HG. . . . . . . . USD 11,420 4.604 16.07 26.11 Accor SA AC. . . . . . . . . EUR 10,686 4.238 13.68 58.14 Hyatt Hotels Corp H . . .. USD 7,806 4,763 5.67 19.16 Choice Hotels International Inc CHA .. . . . . . . . . USD 5,048 1,072 30.77 23.58 Source: Morningstar