

Question: D2L Homepage - ECON13936 Micro E X M Question 5 - Post Class Quiz #4: ( X + X C @ https://ezto.mheducation.com/ext/map/index.html?_con=con&external_browser=0&launchUrl=https%253A%252F%252FIms.mhe... A to .
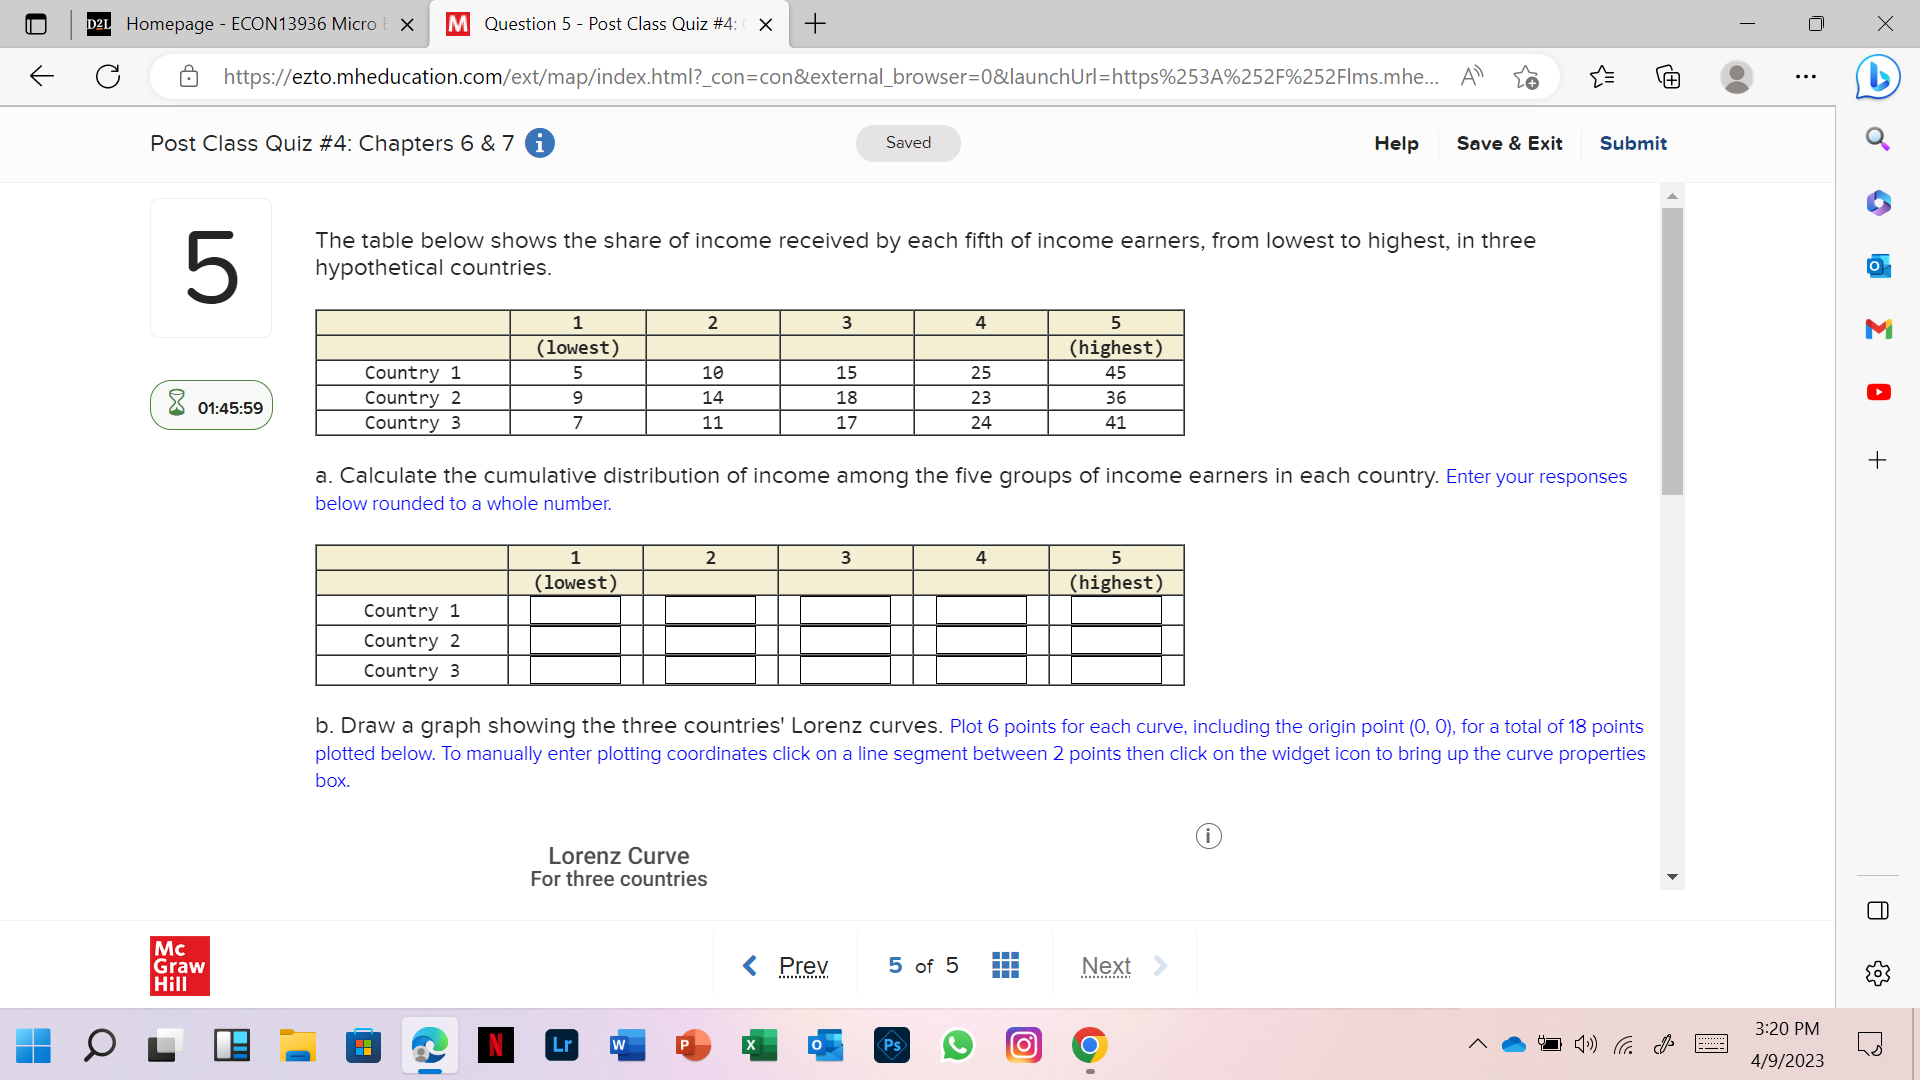
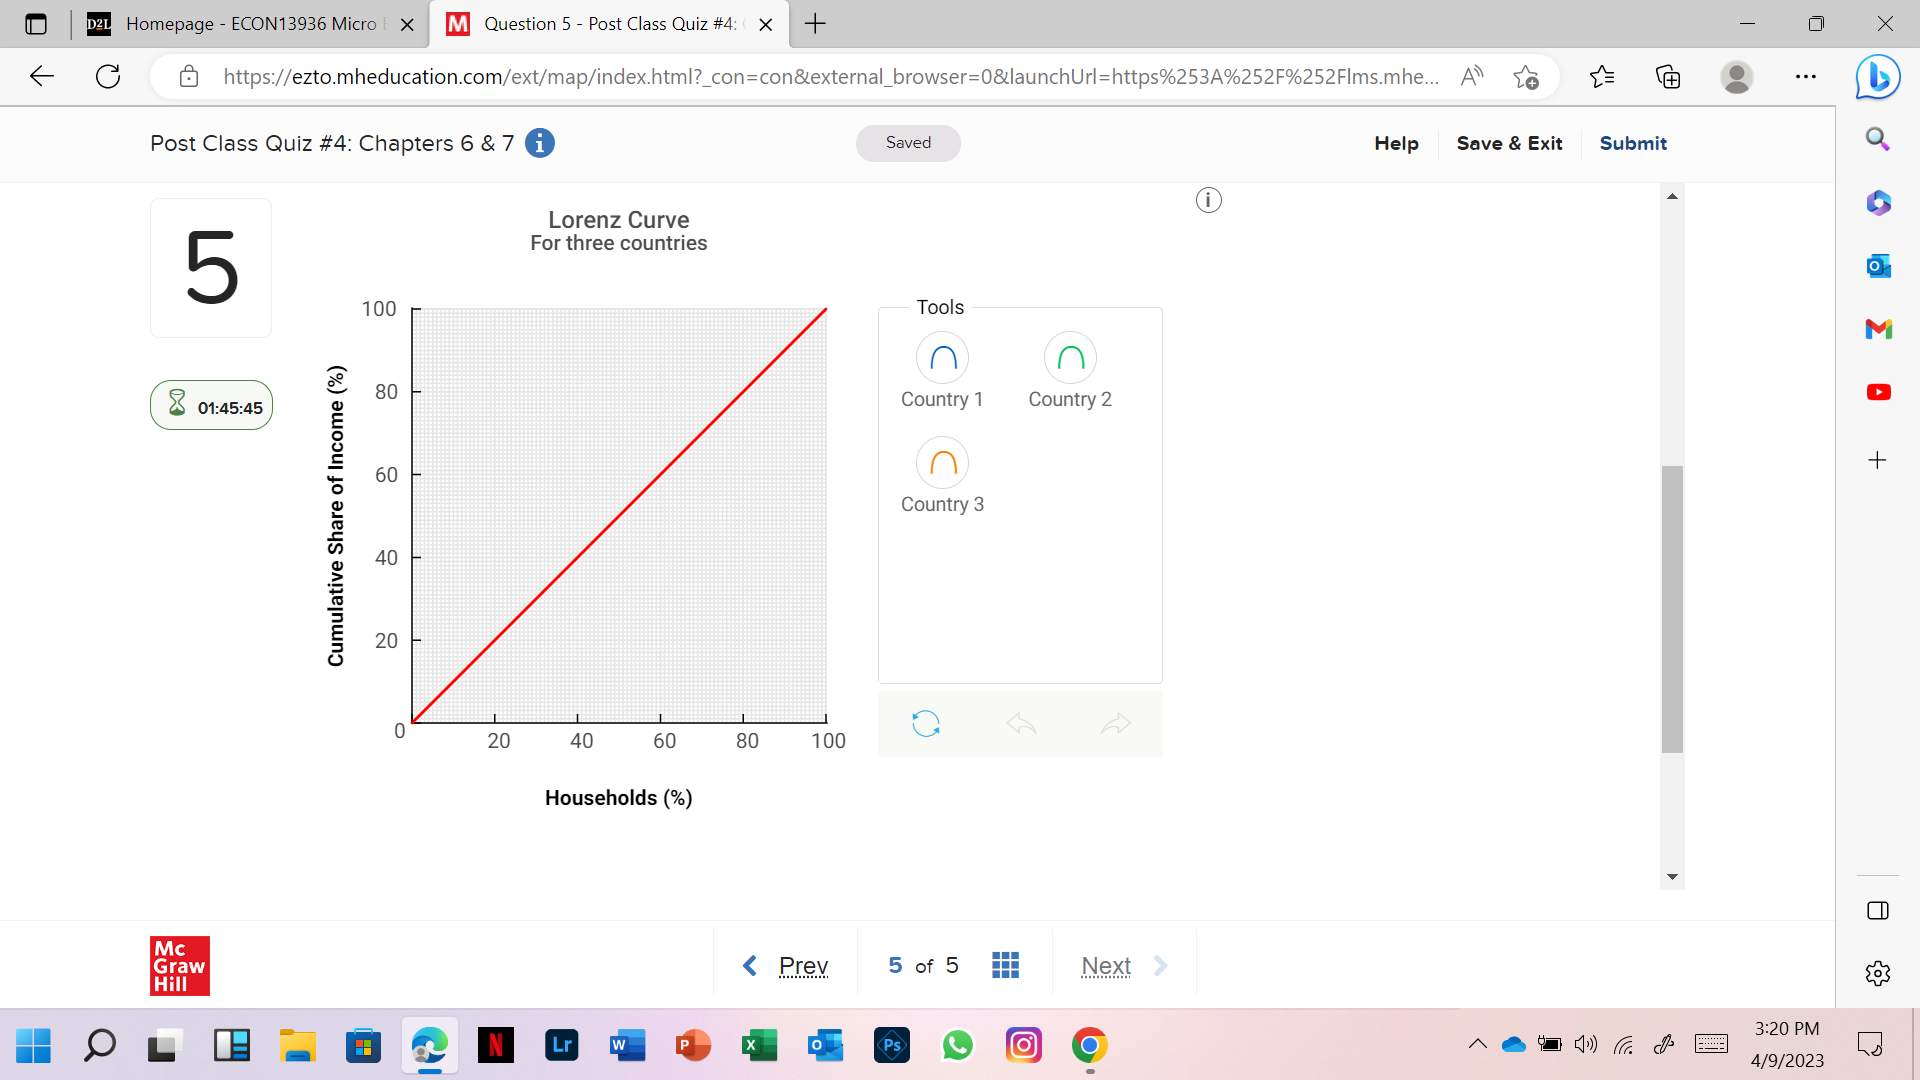
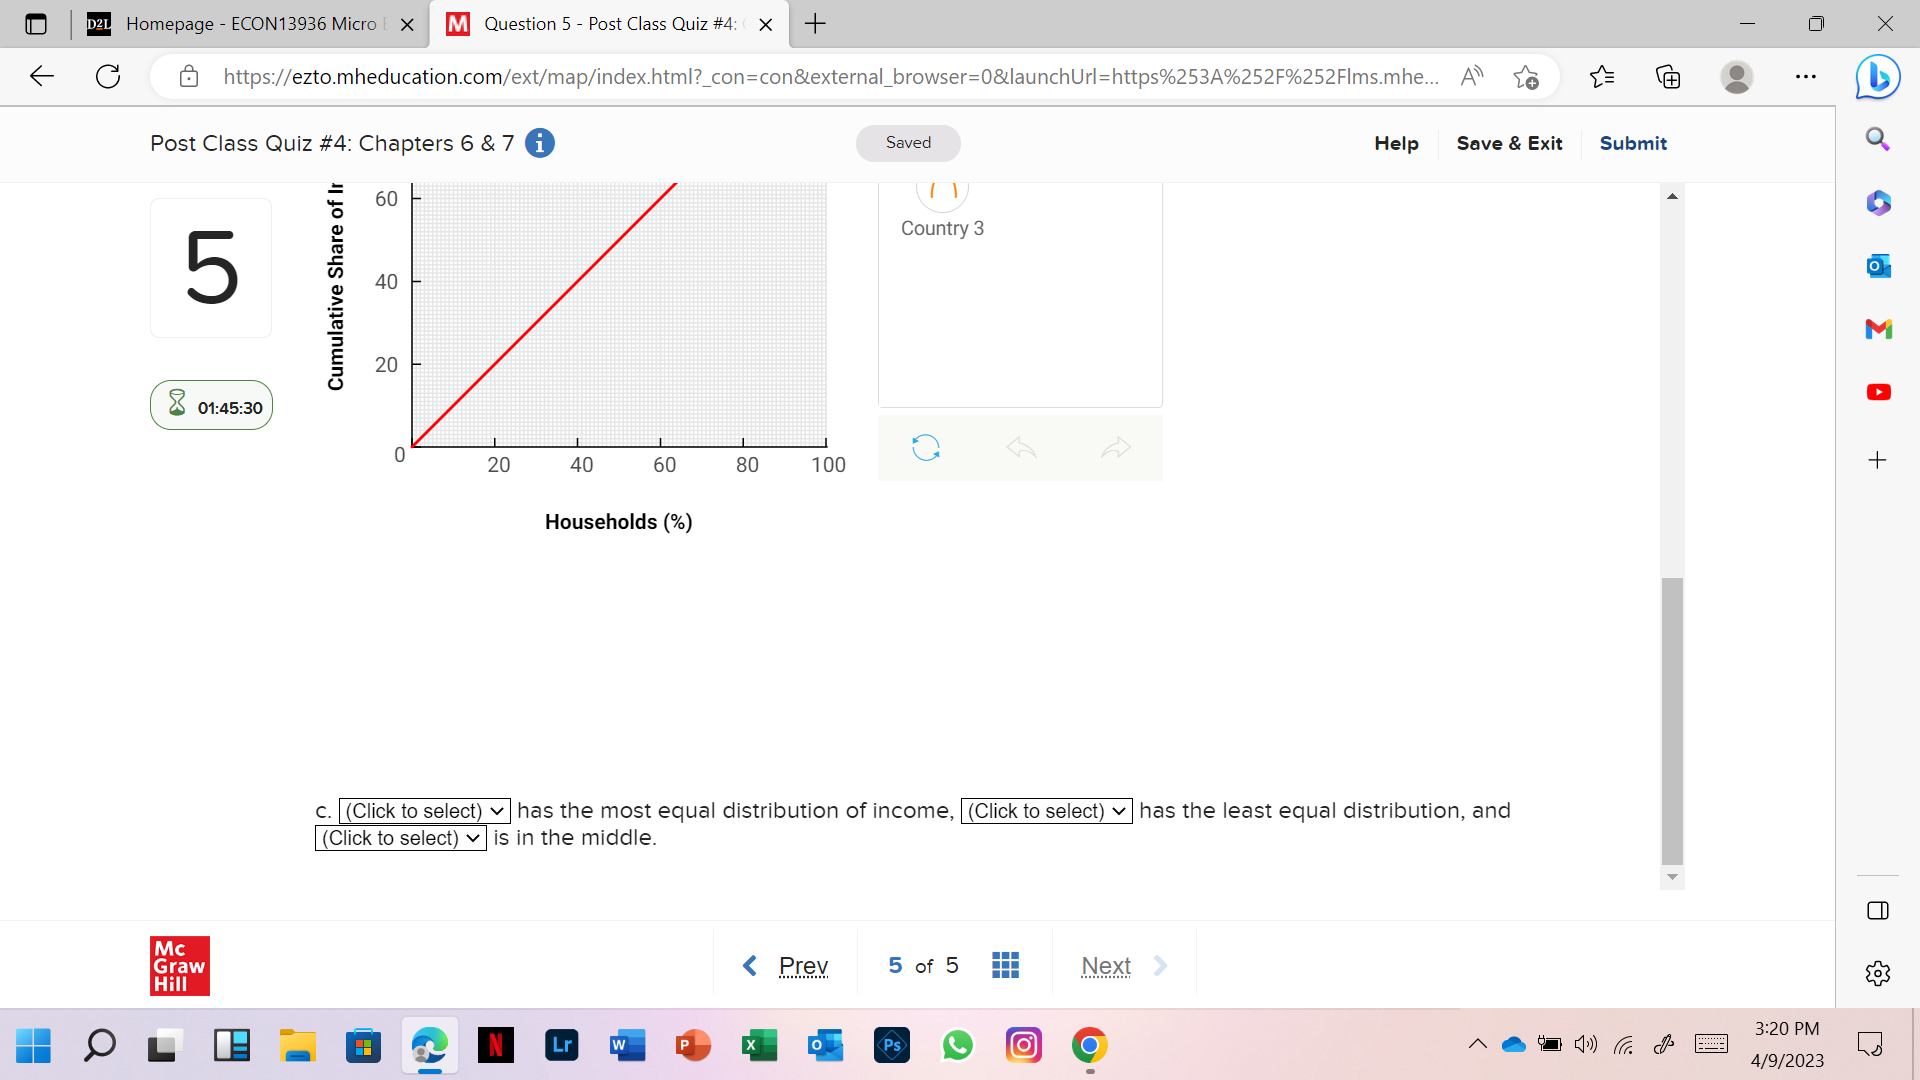
D2L Homepage - ECON13936 Micro E X M Question 5 - Post Class Quiz #4: ( X + X C @ https://ezto.mheducation.com/ext/map/index.html?_con=con&external_browser=0&launchUrl=https%253A%252F%252FIms.mhe... A" to . . . Post Class Quiz #4: Chapters 6 & 7 i Saved Help Save & Exit Submit 5 The table below shows the share of income received by each fifth of income earners, from lowest to highest, in three hypothetical countries. O 1 2 3 4 5 M (lowest) (highest) Country 1 5 10 15 25 45 8 01:45:59 Country 2 9 14 18 23 36 Country 3 7 11 17 24 41 + a. Calculate the cumulative distribution of income among the five groups of income earners in each country. Enter your responses below rounded to a whole number. 1 2 3 4 5 (lowest) highest) Country 1 Country 2 Country 3 b. Draw a graph showing the three countries' Lorenz curves. Plot 6 points for each curve, including the origin point (0, 0), for a total of 18 points plotted below. To manually enter plotting coordinates click on a line segment between 2 points then click on the widget icon to bring up the curve properties box. Lorenz Curve For three countries Mc Graw Hill N 3:20 PM Lr Ps O 4/9/2023D2L Homepage - ECON13936 Micro E X M Question 5 - Post Class Quiz #4: ( X + X C @ https://ezto.mheducation.com/ext/map/index.html?_con=con&external_browser=0&launchUrl=https%253A%252F%252FIms.mhe... A" to . . . Post Class Quiz #4: Chapters 6 & 7 i Saved Help Save & Exit Submit Lorenz Curve 5 For three countries O 100 Tools M n 8 80 01:45:45 Country 1 Country 2 + 60 n Country 3 Cumulative Share of Income (%) 40 20 20 40 60 80 100 Households (%) Mc Graw Hill 3:20 PM N Lr W PS O 4/9/2023D2L Homepage - ECON13936 Micro E X M Question 5 - Post Class Quiz #4: ( X + X C @ https://ezto.mheducation.com/ext/map/index.html?_con=con&external_browser=0&launchUrl=https%253A%252F%252FIms.mhe... A" to . . . Post Class Quiz #4: Chapters 6 & 7 i Saved Help Save & Exit Submit 60 Country 3 5 O Cumulative Share of It 40 M 20 8 01:45:30 20 40 60 80 100 + Households (%) C. (Click to select) v | has the most equal distribution of income, (Click to select) v | has the least equal distribution, and (Click to select) v | is in the middle. Mc Graw N Lr Ps 3:20 PM O' O 4/9/2023
Step by Step Solution
There are 3 Steps involved in it

Get step-by-step solutions from verified subject matter experts