

Question: D3 javascript should be used. You can upload Iris dataset from any website. Part - 1 - Scatter Plot - 30 Points Plot two scatter-plot
D3 javascript should be used. You can upload Iris dataset from any website.
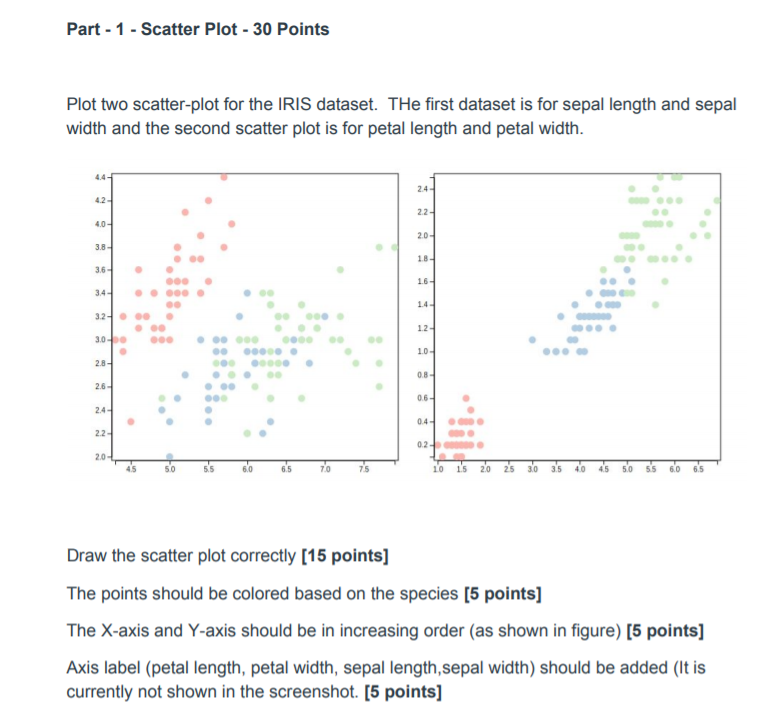
Part - 1 - Scatter Plot - 30 Points Plot two scatter-plot for the IRIS dataset. THe first dataset is for sepal length and sepal width and the second scatter plot is for petal length and petal width. 24- 22- 4.0 - 20- 3.8 18- 36- . 1.6 3.4 1.4 3.2.0 12- 3.00 1.0 2.81 0.81 2.6 06 24- 0.4 2.2 02- 20-4 4.5 5.5 6.0 6.5 70 75 10 15 20 25 30 3.5 40 4.5 50 55 6.0 6.5 Draw the scatter plot correctly (15 points] The points should be colored based on the species (5 points] The X-axis and Y-axis should be in increasing order (as shown in figure) [5 points] Axis label (petal length, petal width, sepal length, sepal width) should be added (It is currently not shown in the screenshot. [5 points] Part - 1 - Scatter Plot - 30 Points Plot two scatter-plot for the IRIS dataset. THe first dataset is for sepal length and sepal width and the second scatter plot is for petal length and petal width. 24- 22- 4.0 - 20- 3.8 18- 36- . 1.6 3.4 1.4 3.2.0 12- 3.00 1.0 2.81 0.81 2.6 06 24- 0.4 2.2 02- 20-4 4.5 5.5 6.0 6.5 70 75 10 15 20 25 30 3.5 40 4.5 50 55 6.0 6.5 Draw the scatter plot correctly (15 points] The points should be colored based on the species (5 points] The X-axis and Y-axis should be in increasing order (as shown in figure) [5 points] Axis label (petal length, petal width, sepal length, sepal width) should be added (It is currently not shown in the screenshot. [5 points]
Step by Step Solution
There are 3 Steps involved in it

Get step-by-step solutions from verified subject matter experts