

Question: D4. Using graphs. A student obtained the following data for an organic compound. She measured the vapor pressure as a function of Temperature. She plotted
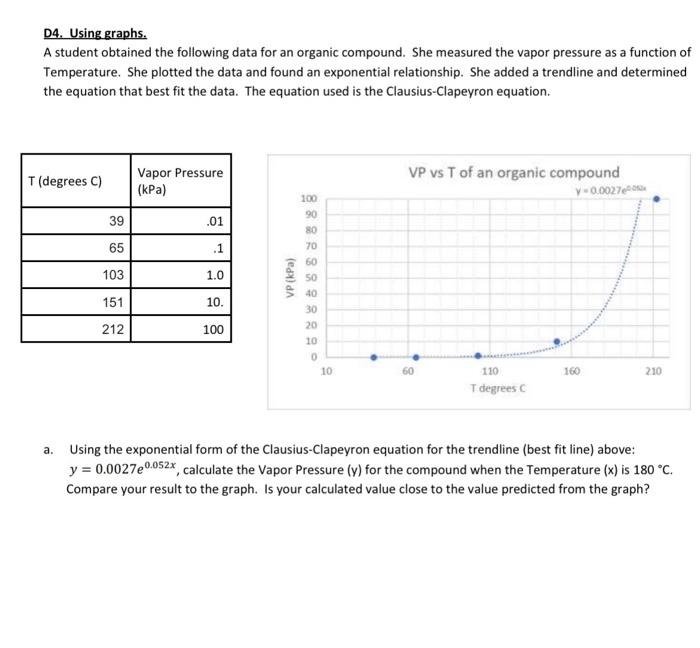
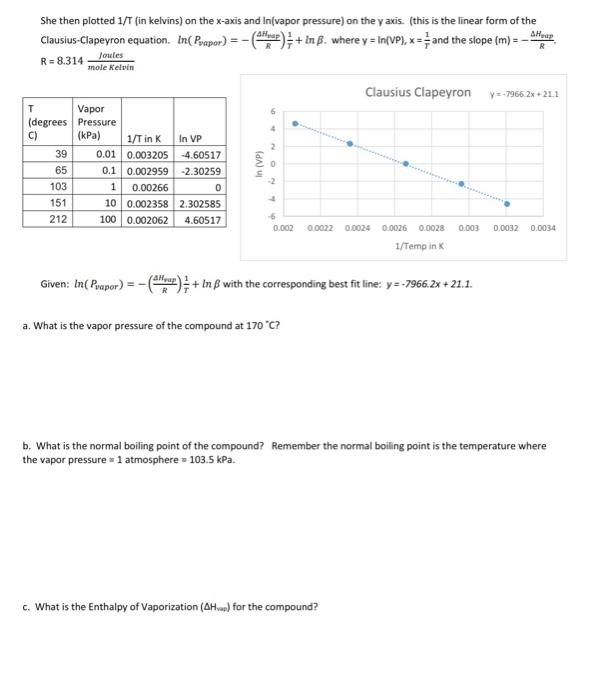
D4. Using graphs. A student obtained the following data for an organic compound. She measured the vapor pressure as a function of Temperature. She plotted the data and found an exponential relationship. She added a trendline and determined the equation that best fit the data. The equation used is the Clausius-Clapeyron equation. a. Using the exponential form of the Clausius-Clapeyron equation for the trendline (best fit line) above: y=0.0027e0.052x, calculate the Vapor Pressure (y) for the compound when the Temperature (x) is 180C. Compare your result to the graph. Is your calculated value close to the value predicted from the graph? She then plotted 1/T (in kelvins) on the x-axis and In(vapor pressure) on the y axis. (this is the linear form of the Clausius-Clapeyron equation. ln(Pvapor)=(RHwap)T1+ln. where y=ln(VP),x=T1 and the slope (m)=RHvap. R=8.314moleKelvinJoules Given: ln(Pvapor)=(RHvup)T1+ln with the corresponding best fit line: y=7966.2x+21.1. a. What is the vapor pressure of the compound at 170C ? b. What is the normal boiling point of the compound? Remember the normal boiling point is the temperature where the vapor pressure =1 atmosphere =103.5kPa. c. What is the Enthalpy of Vaporization ( Hsap ) for the compound
Step by Step Solution
There are 3 Steps involved in it

Get step-by-step solutions from verified subject matter experts