

Question: D8 A B D E F G 7 Ending Inventory Last December 180 8 December Inventory Adjustment 9 Desired Monthly Production 10 11 Capacity Needed
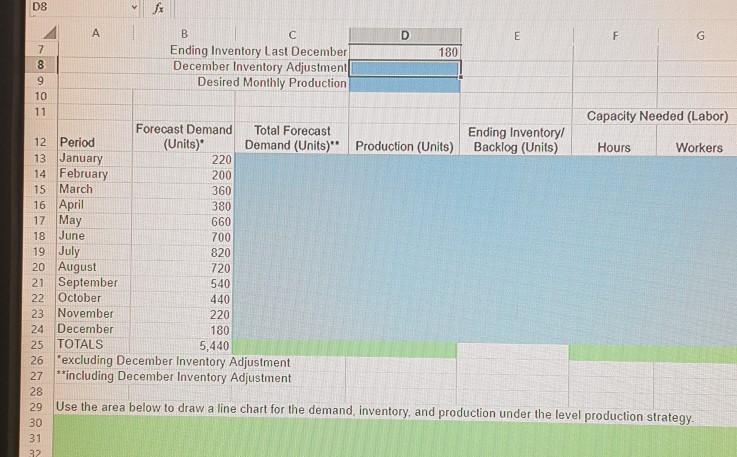
D8 A B D E F G 7 Ending Inventory Last December 180 8 December Inventory Adjustment 9 Desired Monthly Production 10 11 Capacity Needed (Labor) Forecast Demand Total Forecast Ending Inventory/ 12 Period (Units) Demand (Units)" Production (Units) Backlog (Units) Hours Workers 13 January 220 14 February 200 15 March 360 16 April 380 17 May 660 18 June 700 19 July 820 20 August 720 21 September 540 22 October 440 23 November 220 24 December 180 25 TOTALS 5,440 26 'excluding December Inventory Adjustment 27 **including December Inventory Adjustment 28 29 Use the area below to draw a line chart for the demand, inventory, and production under the level production strategy. 30 31 32 D8 A B D E F G 7 Ending Inventory Last December 180 8 December Inventory Adjustment 9 Desired Monthly Production 10 11 Capacity Needed (Labor) Forecast Demand Total Forecast Ending Inventory/ 12 Period (Units) Demand (Units)" Production (Units) Backlog (Units) Hours Workers 13 January 220 14 February 200 15 March 360 16 April 380 17 May 660 18 June 700 19 July 820 20 August 720 21 September 540 22 October 440 23 November 220 24 December 180 25 TOTALS 5,440 26 'excluding December Inventory Adjustment 27 **including December Inventory Adjustment 28 29 Use the area below to draw a line chart for the demand, inventory, and production under the level production strategy. 30 31 32
Step by Step Solution
There are 3 Steps involved in it

Get step-by-step solutions from verified subject matter experts