

Question: DA 1 3 . 1 Data analytics can be used to understand present values. GlobalPie plans to issue 1 0 year, semi annual bonds. They
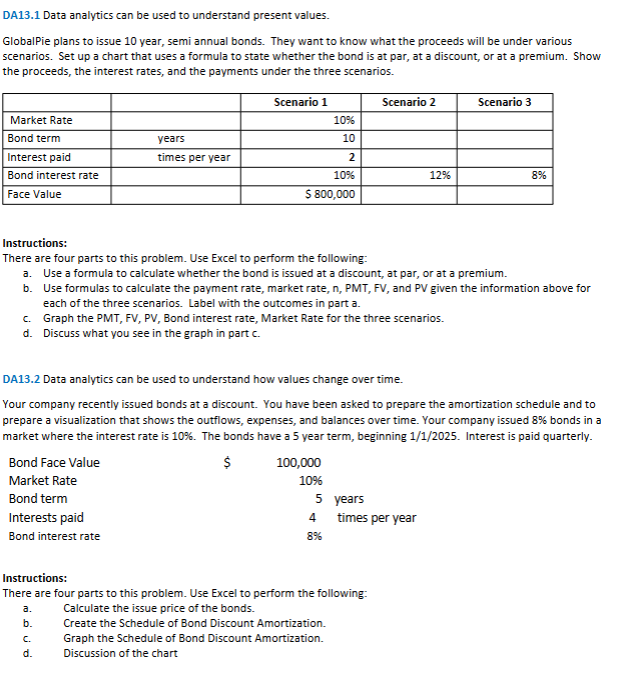
DA Data analytics can be used to understand present values. GlobalPie plans to issue year, semi annual bonds. They want to know what the proceeds will be under various scenarios. Set up a chart that uses a formula to state whether the bond is at par, at a discount, or at a premium. Show the proceeds, the interest rates, and the payments under the three scenarios. Instructions: There are four parts to this problem. Use Excel to perform the following: a Use a formula to calculate whether the bond is issued at a discount, at par, or at a premium. b Use formulas to calculate the payment rate, market rate, n PMT FV and PV given the information above for each of the three scenarios. Label with the outcomes in part a c Graph the PMT FV PV Bond interest rate, Market Rate for the three scenarios. d Discuss what you see in the graph in part c DA Data analytics can be used to understand how values change over time. Your company recently issued bonds at a discount. You have been asked to prepare the amortization schedule and to prepare a visualization that shows the outflows, expenses, and balances over time. Your company issued bonds in a market where the interest rate is The bonds have a year term, beginning Interest is paid quarterly. Instructions: There are four parts to this problem. Use Excel to perform the following: a Calculate the issue price of the bonds. b Create the Schedule of Bond Discount Amortization. c Graph the Schedule of Bond Discount Amortization. d Discussion of the chart
Step by Step Solution
There are 3 Steps involved in it
1 Expert Approved Answer
Step: 1 Unlock

Question Has Been Solved by an Expert!
Get step-by-step solutions from verified subject matter experts
Step: 2 Unlock
Step: 3 Unlock