

Question: DA 2 2 . 1 Data visualization can be used to compare income effects of shortterm decisions. For this case, you will use an approach
DA Data visualization can be used to compare income effects of shortterm decisions.
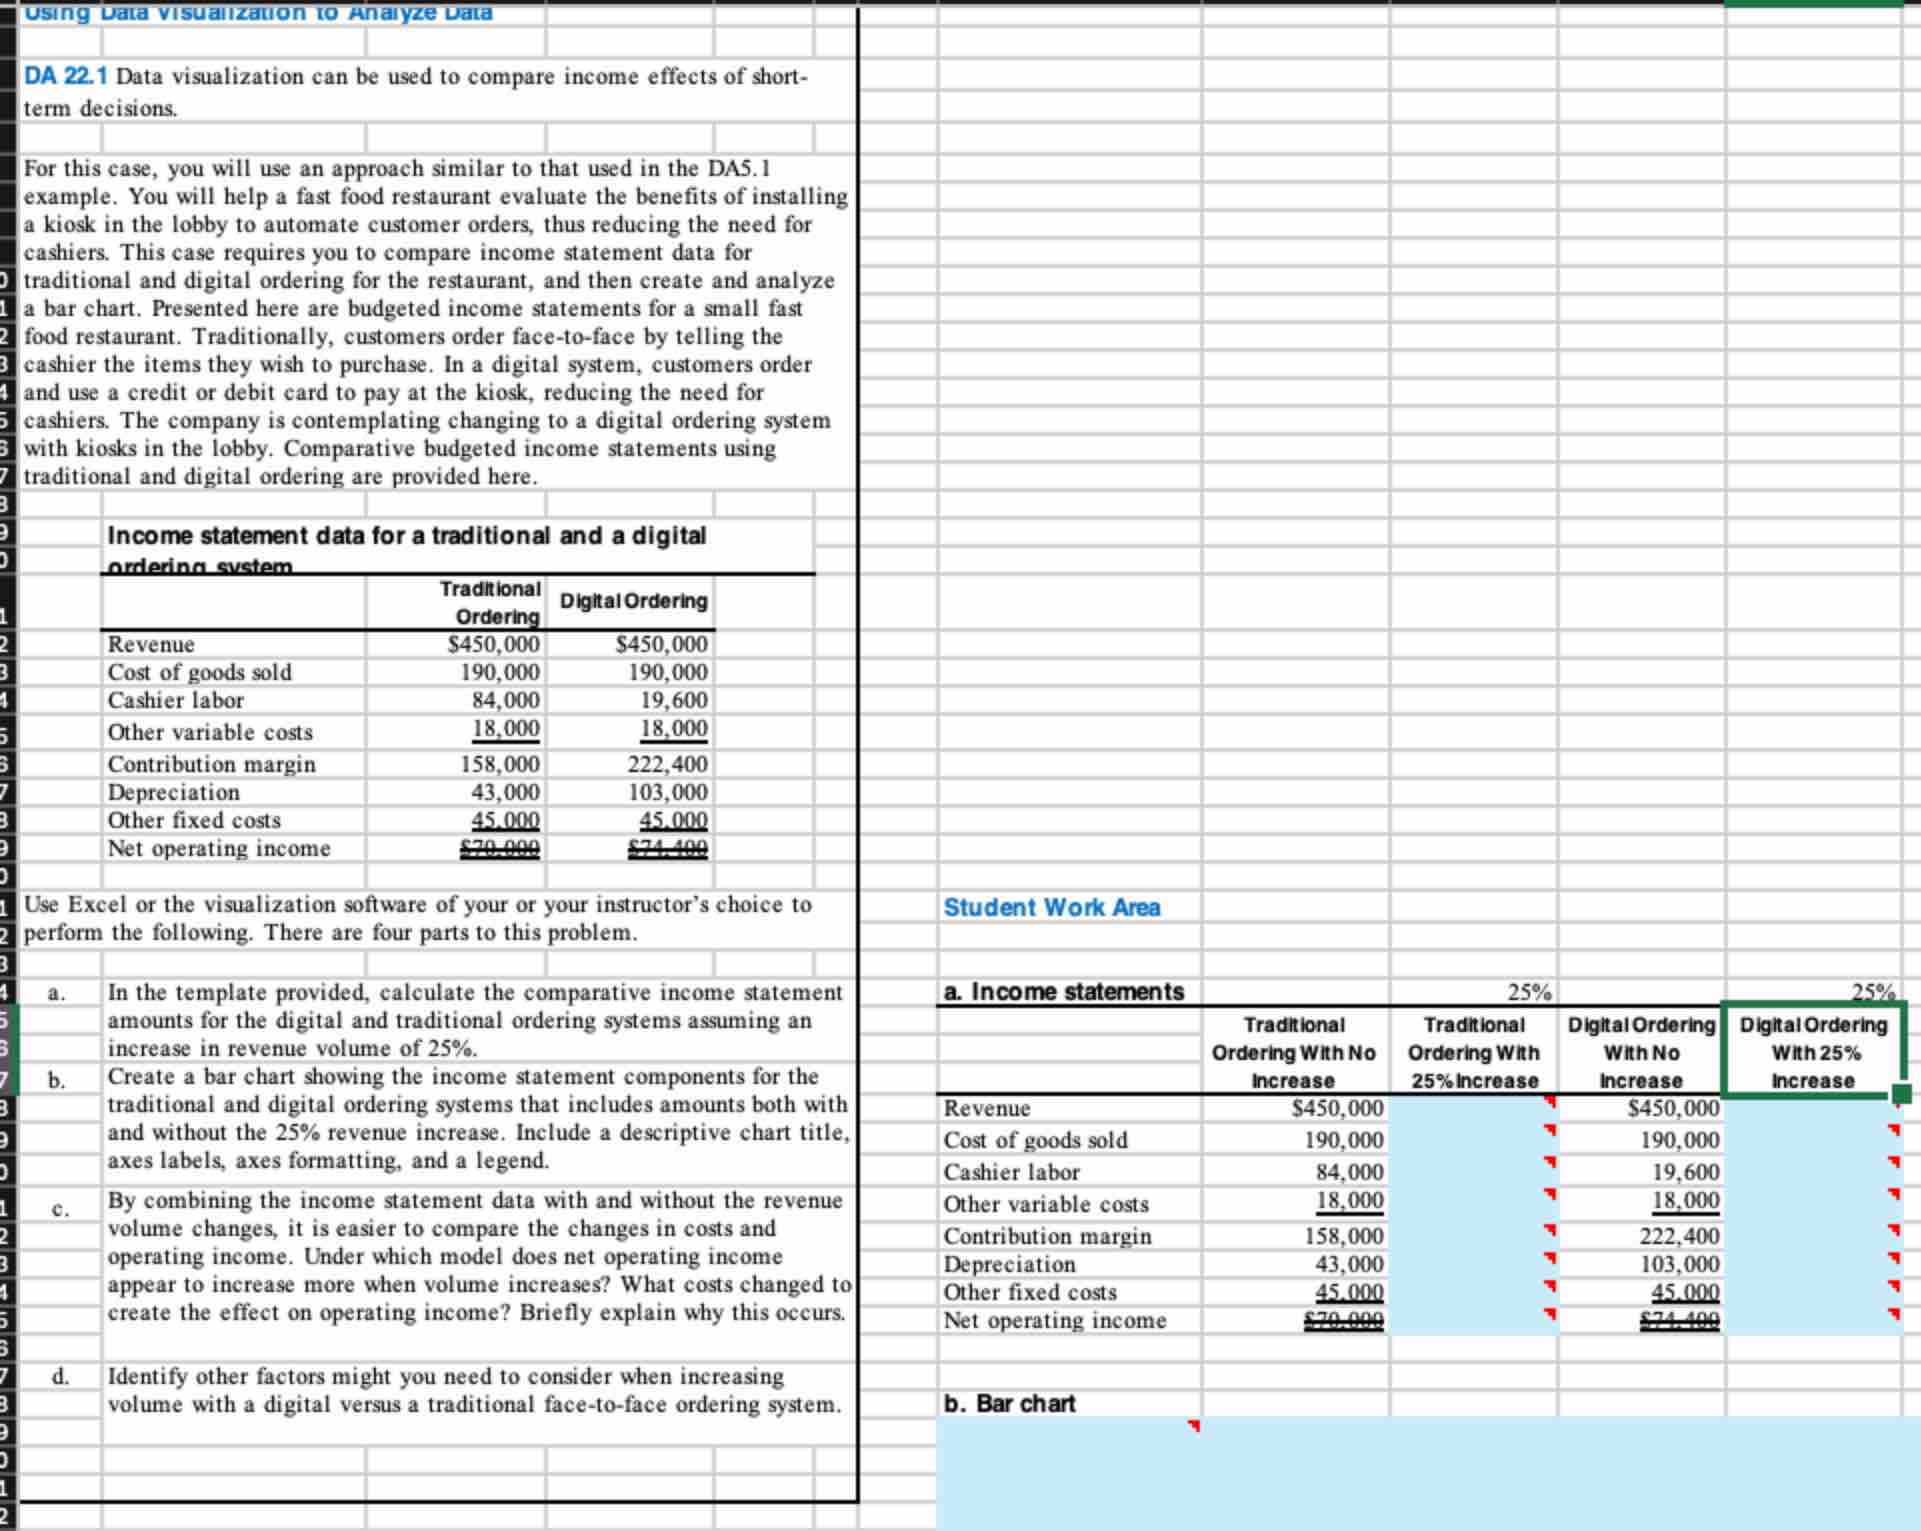
For this case, you will use an approach similar to that used in the DA example. You will help a fast food restaurant evaluate the benefits of installing a kiosk in the lobby to automate customer orders, thus reducing the need for cashiers. This case requires you to compare income statement data for traditional and digital ordering for the restaurant, and then create and analyze a bar chart. Presented here are budgeted income statements for a small fast food restaurant. Traditionally, customers order facetoface by telling the cashier the items they wish to purchase. In a digital system, customers order and use a credit or debit card to pay at the kiosk, reducing the need for cashiers. The company is contemplating changing to a digital ordering system with kiosks in the lobby. Comparative budgeted income statements using traditional and digital ordering are provided here.
Use Excel or the visualization software of your or your instructor's choice to perform the following. There are four parts to this problem.
a In the template provided, calculate the comparative income statement amounts for the digital and traditional ordering systems assuming an increase in revenue volume of
b Create a bar chart showing the income statement components for the traditional and digital ordering systems that includes amounts both with and without the revenue increase. Include a descriptive chart title, axes labels, axes formatting, and a legend.
c By combining the income statement data with and without the revenue volume changes, it is easier to compare the changes in costs and operating income. Under which model does net operating income appear to increase more when volume increases? What costs changed to create the effect on operating income? Briefly explain why this occurs.
d Identify other factors might you need to consider when increasing volume with a digital versus a traditional facetoface ordering system.
Step by Step Solution
There are 3 Steps involved in it
1 Expert Approved Answer
Step: 1 Unlock

Question Has Been Solved by an Expert!
Get step-by-step solutions from verified subject matter experts
Step: 2 Unlock
Step: 3 Unlock