

Question: Dashboard x _ Homework 4A X B BVT Publishing - Micro EASE( X Micro Easeonomics: Fundam X G how to take a screenshot on X
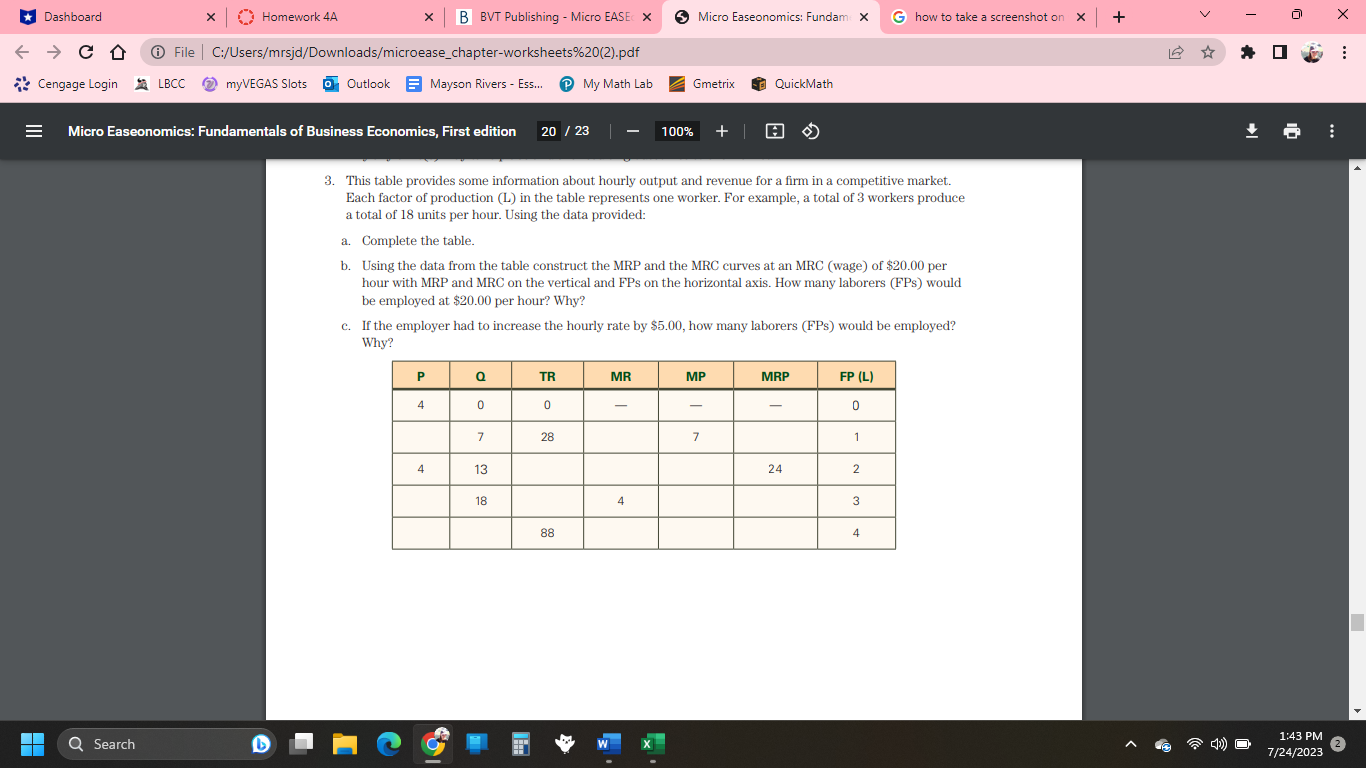

Dashboard x _ Homework 4A X B BVT Publishing - Micro EASE( X Micro Easeonomics: Fundam X G how to take a screenshot on X + V X C D @ File | C:/Users/mrsjd/Downloads/microease_chapter-worksheets%20(2).pdf Cengage Login LBCC @ myVEGAS Slots )|Outlook _ Mayson Rivers - Ess... P My Math Lab Gmetrix QuickMath E Micro Easeonomics: Fundamentals of Business Economics, First edition 20 / 23 100% + 3. This table provides some information about hourly output and revenue for a firm in a competitive market. Each factor of production (L) in the table represents one worker. For example, a total of 3 workers produce a total of 18 units per hour. Using the data provided: a. Complete the table. b. Using the data from the table construct the MRP and the MRC curves at an MRC (wage) of $20.00 per hour with MRP and MRC on the vertical and FPs on the horizontal axis. How many laborers (FPs) would be employed at $20.00 per hour? Why? c. If the employer had to increase the hourly rate by $5.00, how many laborers (FPs) would be employed? Why? P Q TR MR MP MRP FP (L) 0 7 28 7 1 4 13 24 2 18 4 3 88 4 Q Search D W 1:43 PM () O 7/24/2023
Step by Step Solution
There are 3 Steps involved in it

Get step-by-step solutions from verified subject matter experts