

Question: DATA: (15 pts) To better understand the risks involved, perform a sensitivity analysis for the best alternative by considering the following: - LOW case (Sensitivity
DATA:
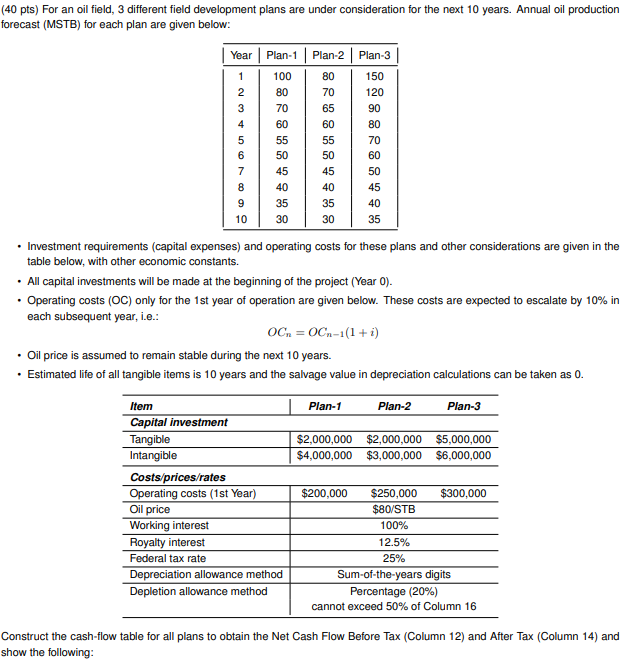
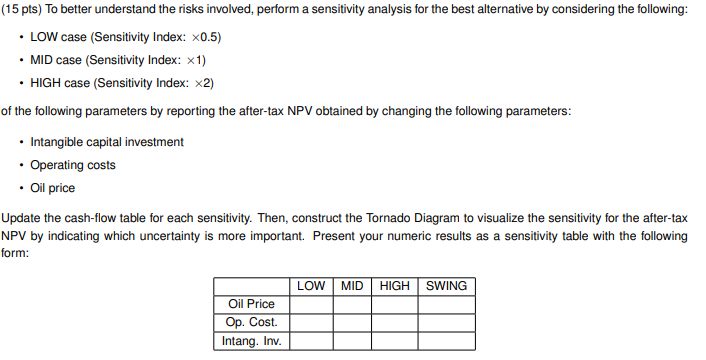
(15 pts) To better understand the risks involved, perform a sensitivity analysis for the best alternative by considering the following: - LOW case (Sensitivity Index: 0.5 ) - MID case (Sensitivity Index: 1 ) - HIGH case (Sensitivity Index: 2 ) of the following parameters by reporting the after-tax NPV obtained by changing the following parameters: - Intangible capital investment - Operating costs - Oil price Update the cash-flow table for each sensitivity. Then, construct the Tornado Diagram to visualize the sensitivity for the after-tax NPV by indicating which uncertainty is more important. Present your numeric results as a sensitivity table with the following form: (40 pts) For an oil field, 3 different field development plans are under consideration for the next 10 years. Annual oil production forecast (MSTB) for each plan are given below: - Investment requirements (capital expenses) and operating costs for these plans and other considerations are given in the table below, with other economic constants. - All capital investments will be made at the beginning of the project (Year 0 ). - Operating costs (OC) only for the 1st year of operation are given below. These costs are expected to escalate by 10% in each subsequent year, i.e.: OCn=OCn1(1+i) - Oil price is assumed to remain stable during the next 10 years. - Estimated life of all tangible items is 10 years and the salvage value in depreciation calculations can be taken as 0. Construct the cash-flow table for all plans to obtain the Net Cash Flow Before Tax (Column 12) and After Tax (Column 14) and show the following: (15 pts) To better understand the risks involved, perform a sensitivity analysis for the best alternative by considering the following: - LOW case (Sensitivity Index: 0.5 ) - MID case (Sensitivity Index: 1 ) - HIGH case (Sensitivity Index: 2 ) of the following parameters by reporting the after-tax NPV obtained by changing the following parameters: - Intangible capital investment - Operating costs - Oil price Update the cash-flow table for each sensitivity. Then, construct the Tornado Diagram to visualize the sensitivity for the after-tax NPV by indicating which uncertainty is more important. Present your numeric results as a sensitivity table with the following form: (40 pts) For an oil field, 3 different field development plans are under consideration for the next 10 years. Annual oil production forecast (MSTB) for each plan are given below: - Investment requirements (capital expenses) and operating costs for these plans and other considerations are given in the table below, with other economic constants. - All capital investments will be made at the beginning of the project (Year 0 ). - Operating costs (OC) only for the 1st year of operation are given below. These costs are expected to escalate by 10% in each subsequent year, i.e.: OCn=OCn1(1+i) - Oil price is assumed to remain stable during the next 10 years. - Estimated life of all tangible items is 10 years and the salvage value in depreciation calculations can be taken as 0. Construct the cash-flow table for all plans to obtain the Net Cash Flow Before Tax (Column 12) and After Tax (Column 14) and show the following
Step by Step Solution
There are 3 Steps involved in it

Get step-by-step solutions from verified subject matter experts