

Question: Data: 4 2 4.8 2.7 4.8 2.9 5.5 3 3.7 3 3.2 3.2 3 3.4 5.4 3.6 3 3.7 3.6 4 4.9 4 4 4.3
 Data:
Data:
| 4 | 2 |
| 4.8 | 2.7 |
| 4.8 | 2.9 |
| 5.5 | 3 |
| 3.7 | 3 |
| 3.2 | 3.2 |
| 3 | 3.4 |
| 5.4 | 3.6 |
| 3 | 3.7 |
| 3.6 | 4 |
| 4.9 | 4 |
| 4 | 4.3 |
| 5 | 4.5 |
| 4.3 | 4.8 |
| 2.7 | 4.8 |
| 2 | 4.9 |
| 2.9 | 5 |
| 3.4 | 5 |
| 4.5 | 5.4 |
| 5 | 5.5 |
Please attach the screenshots of the Minitab diagrams and all. Also, add numerical summaries obtained from MINITAB followed by hand calculations for the required summaries to verify numerical summaries obtained from MINITAB
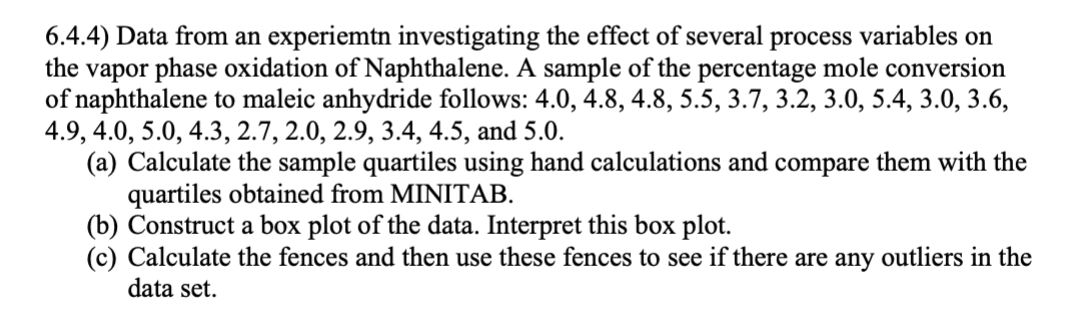
6.4.4) Data from an experiemtn investigating the effect of several process variables on the vapor phase oxidation of Naphthalene. A sample of the percentage mole conversion of naphthalene to maleic anhydride follows: 4.0, 4.8, 4.8, 5.5, 3.7, 3.2, 3.0, 5.4, 3.0, 3.6, 4.9, 4.0, 5.0, 4.3, 2.7, 2.0, 2.9, 3.4, 4.5, and 5.0. (a) Calculate the sample quartiles using hand calculations and compare them with the quartiles obtained from MINITAB. (b) Construct a box plot of the data. Interpret this box plot. (c) Calculate the fences and then use these fences to see if there are any outliers in the data setStep by Step Solution
There are 3 Steps involved in it
1 Expert Approved Answer
Step: 1 Unlock

Question Has Been Solved by an Expert!
Get step-by-step solutions from verified subject matter experts
Step: 2 Unlock
Step: 3 Unlock