

Question: Data A manufacturing operation has collected 1 2 samples containing 7 5 observations each. The components are evaluated based on a defective, or nonconforming state.
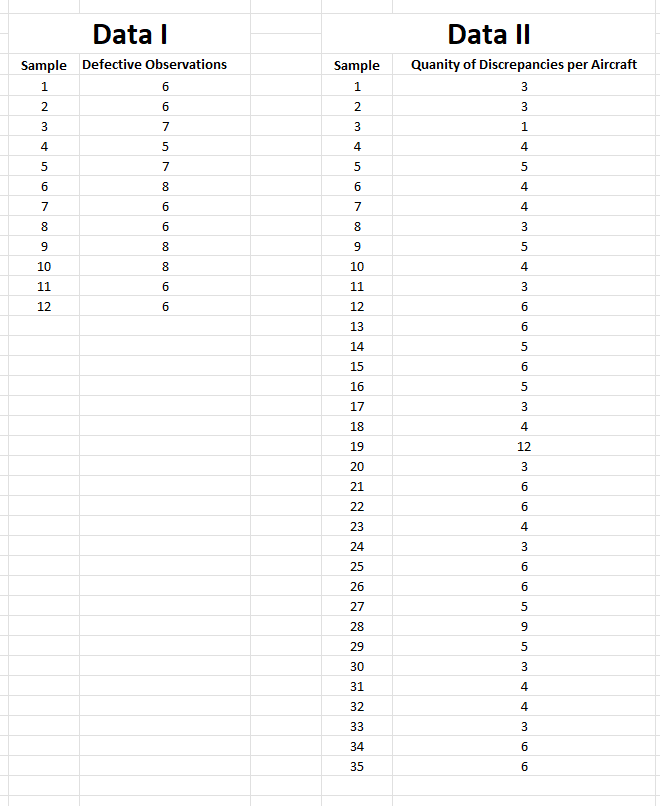
Data
A manufacturing operation has collected samples containing observations each. The components are evaluated based on a defective, or nonconforming state.
List the Control Chart Type
Calculate the Target, LCL and UCL z
Target
LCL
UCL
Is the process in or out of control? What evidence supports this assessment?
Data II
A HEMS overhaul shop has collected data on EMS aircraft that have been overhauled and released for inspection. The discrepancies are typically resultant from abnormal vibration, fluid leaks and electrical malfunctions. Using samples, or aircraft, discrepancies per aircraft have been recorded.
List the Control Chart Type
Calculate the Target, LCL and UCL z
Is the process in or out of control? What evidence supports this assessment?
Control charts and conditional formatting is not required.
Step by Step Solution
There are 3 Steps involved in it
1 Expert Approved Answer
Step: 1 Unlock

Question Has Been Solved by an Expert!
Get step-by-step solutions from verified subject matter experts
Step: 2 Unlock
Step: 3 Unlock