

Question: ----------------------------- DATA AA AXP BA BAC CAT CSCO CVX DD DIS GE HD HPQ IBM INTC JNJ JPM KO MCD MMM MRK MSFT PFE PG
-----------------------------
DATA
| AA | AXP | BA | BAC | CAT | CSCO | CVX | DD | DIS | GE | HD | HPQ | IBM | INTC | JNJ | JPM | KO | MCD | MMM | MRK | MSFT | PFE | PG | T | TRV | UNH | UTX | VZ | WMT | XOM |
| -0.09 | -0.05 | -0.05 | 0.07 | -0.02 | -0.09 | -0.11 | 0.02 | -0.08 | -0.05 | 0.14 | -0.13 | -0.01 | -0.21 | -0.05 | 0.09 | -0.04 | -0.09 | -0.06 | -0.21 | -0.08 | 0.03 | -0.10 | -0.06 | -0.11 | -0.13 | -0.04 | -0.10 | 0.07 | -0.08 |
| 0.13 | -0.14 | 0.00 | -0.10 | 0.02 | 0.00 | 0.05 | 0.04 | 0.09 | -0.05 | -0.13 | 0.09 | 0.07 | -0.05 | -0.01 | -0.14 | -0.01 | 0.02 | -0.01 | -0.04 | -0.16 | -0.03 | 0.01 | -0.10 | -0.04 | -0.09 | -0.03 | -0.06 | -0.02 | 0.01 |
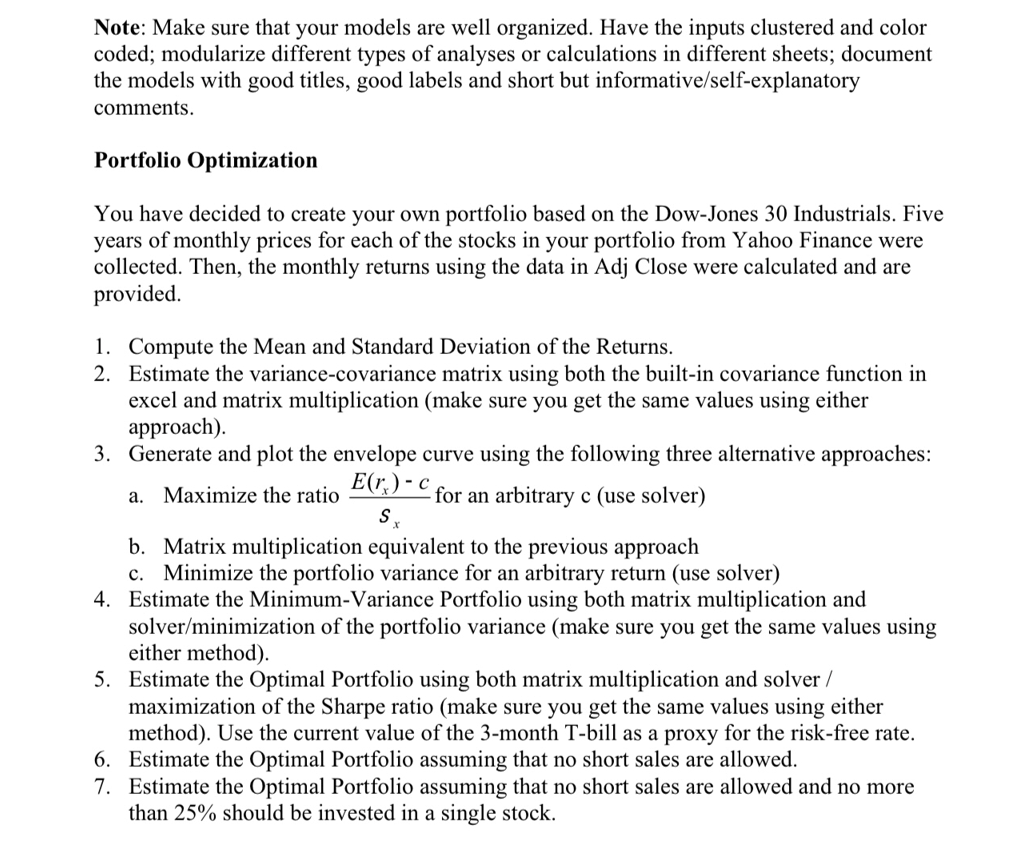
Note: Make sure that your models are well organized. Have the inputs clustered and color coded; modularize different types of analyses or calculations in different sheets; document the models with good titles, good labels and short but informative/self-explanatory comments. Portfolio Optimization You have decided to create your own portfolio based on the Dow-Jones 30 Industrials. Five years of monthly prices for each of the stocks in your portfolio from Yahoo Finance were collected. Then, the monthly returns using the data in Adj Close were calculated and are provided. 1. Compute the Mean and Standard Deviation of the Returns. 2. Estimate the variance-covariance matrix using both the built-in covariance function in excel and matrix multiplication (make sure you get the same values using either approach). 3. Generate and plot the envelope curve using the following three alternative approaches: a. Maximize the ratio E(r) -C for an arbitrary c (use solver) S b. Matrix multiplication equivalent to the previous approach c. Minimize the portfolio variance for an arbitrary return (use solver) 4. Estimate the Minimum-Variance Portfolio using both matrix multiplication and solver/minimization of the portfolio variance (make sure you get the same values using either method). 5. Estimate the Optimal Portfolio using both matrix multiplication and solver / maximization of the Sharpe ratio (make sure you get the same values using either method). Use the current value of the 3-month T-bill as a proxy for the risk-free rate. 6. Estimate the Optimal Portfolio assuming that no short sales are allowed. 7. Estimate the Optimal Portfolio assuming that no short sales are allowed and no more than 25% should be invested in a single stock. Note: Make sure that your models are well organized. Have the inputs clustered and color coded; modularize different types of analyses or calculations in different sheets; document the models with good titles, good labels and short but informative/self-explanatory comments. Portfolio Optimization You have decided to create your own portfolio based on the Dow-Jones 30 Industrials. Five years of monthly prices for each of the stocks in your portfolio from Yahoo Finance were collected. Then, the monthly returns using the data in Adj Close were calculated and are provided. 1. Compute the Mean and Standard Deviation of the Returns. 2. Estimate the variance-covariance matrix using both the built-in covariance function in excel and matrix multiplication (make sure you get the same values using either approach). 3. Generate and plot the envelope curve using the following three alternative approaches: a. Maximize the ratio E(r) -C for an arbitrary c (use solver) S b. Matrix multiplication equivalent to the previous approach c. Minimize the portfolio variance for an arbitrary return (use solver) 4. Estimate the Minimum-Variance Portfolio using both matrix multiplication and solver/minimization of the portfolio variance (make sure you get the same values using either method). 5. Estimate the Optimal Portfolio using both matrix multiplication and solver / maximization of the Sharpe ratio (make sure you get the same values using either method). Use the current value of the 3-month T-bill as a proxy for the risk-free rate. 6. Estimate the Optimal Portfolio assuming that no short sales are allowed. 7. Estimate the Optimal Portfolio assuming that no short sales are allowed and no more than 25% should be invested in a single stock
Step by Step Solution
There are 3 Steps involved in it

Get step-by-step solutions from verified subject matter experts