

Question: data above is the datafile asked to load/provided 121 double begin{tabular}{|c|r|} hline & multicolumn{1}{|c|}{1} hline 1 & 20.1747 hline 2 & 9.7816
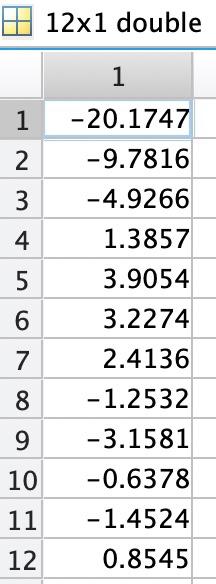
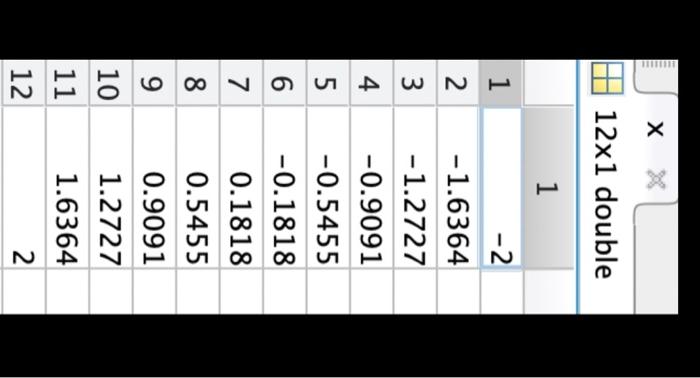
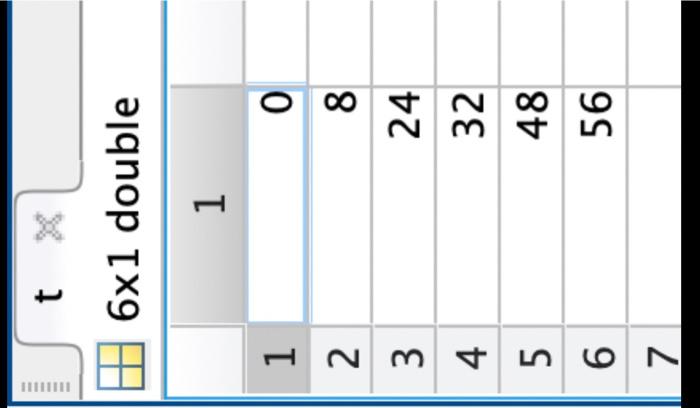
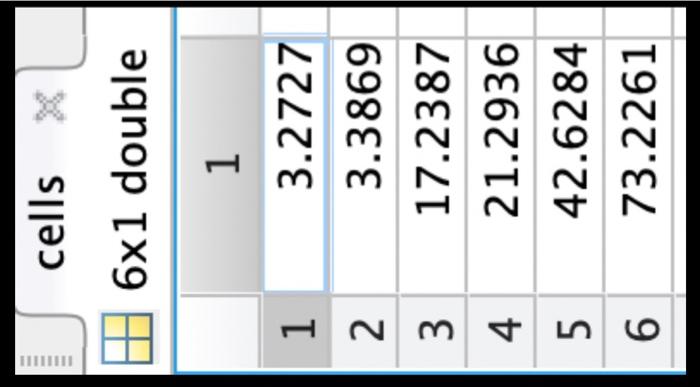
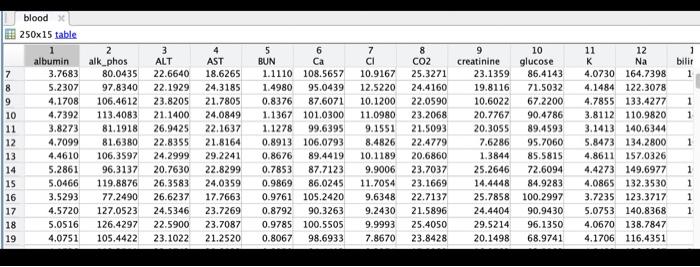
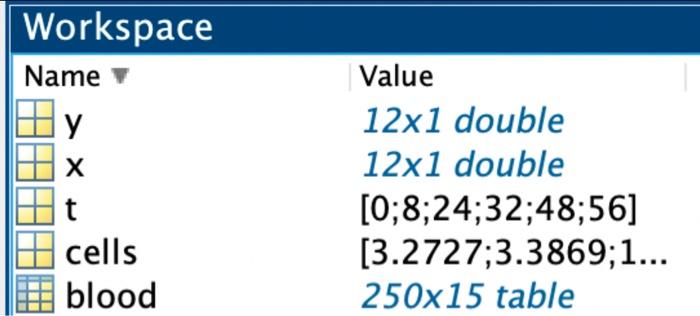
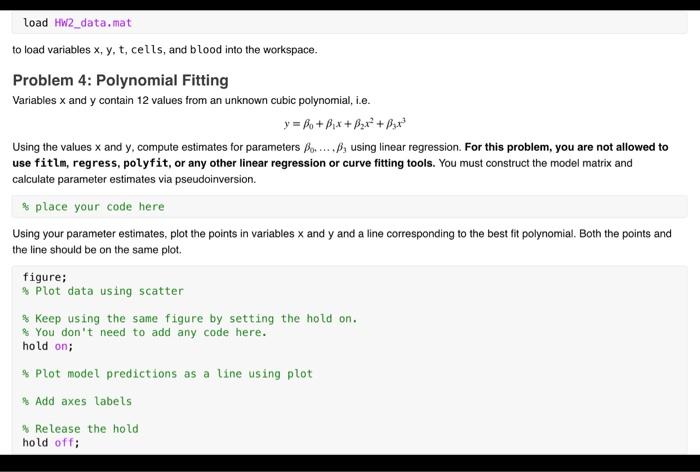
121 double \begin{tabular}{|c|r|} \hline & \multicolumn{1}{|c|}{1} \\ \hline 1 & 20.1747 \\ \hline 2 & 9.7816 \\ \hline 3 & 4.9266 \\ \hline 4 & 1.3857 \\ \hline 5 & 3.9054 \\ \hline 6 & 3.2274 \\ \hline 7 & 2.4136 \\ \hline 8 & 1.2532 \\ \hline 9 & 3.1581 \\ \hline 10 & 0.6378 \\ \hline 11 & 1.4524 \\ \hline 12 & 0.8545 \\ \hline \end{tabular} 121 double \begin{tabular}{|c|r|} \hline & \multicolumn{1}{|c|}{1} \\ \hline 1 & 2 \\ \hline 2 & 1.6364 \\ \hline 3 & 1.2727 \\ \hline 4 & 0.9091 \\ \hline 5 & 0.5455 \\ \hline 6 & 0.1818 \\ \hline 7 & 0.1818 \\ \hline 8 & 0.5455 \\ \hline 9 & 0.9091 \\ \hline 10 & 1.2727 \\ \hline 11 & 1.6364 \\ \hline 12 & 2 \\ \hline \end{tabular} 61 double \begin{tabular}{|r|r|} \hline & 1 \\ \hline 1 & 0 \\ \hline 2 & 8 \\ \hline 3 & 24 \\ \hline 4 & 32 \\ \hline 5 & 48 \\ \hline 6 & 56 \\ \hline 7 & \\ \hline \end{tabular} cells 61 double \begin{tabular}{|l|r|} \hline & \multicolumn{1}{|c|}{1} \\ \hline 1 & 3.2727 \\ \hline 2 & 3.3869 \\ \hline 3 & 17.2387 \\ \hline 4 & 21.2936 \\ \hline 5 & 42.6284 \\ \hline 6 & 73.2261 \\ \hline \end{tabular} blood 25015 table. \begin{tabular}{|ll|} \hline Workspace & \\ \hline Name & Value \\ #y & 121 double \\ x & 121 double \\ # t & {[0;8;24;32;48;56]} \\ cells & {[3.2727;3.3869;1} \\ blood & 25015 table \end{tabular} to load variables x,y,t, cells, and blood into the workspace. Problem 4: Polynomial Fitting Variables x and y contain 12 values from an unknown cubic polynomial, i.e. y=0+1x+2x2+3x3 Using the values x and y, compute estimates for parameters 0,3 using linear regression. For this problem, you are not allowed to use fitlm, regress, polyfit, or any other linear regression or curve fitting tools. You must construct the model matrix and calculate parameter estimates via pseudoinversion. s place your code here Using your parameter estimates, plot the points in variables x and y and a line corresponding to the best fit polynomial. Both the points and the line should be on the same plot. figure; \% Plot data using scatter s Keep using the same figure by setting the hold on. \& You don't need to add any code here. hold on; \% Plot model predictions as a line using plot \%. Add axes labels \% Release the hold hold off
Step by Step Solution
There are 3 Steps involved in it

Get step-by-step solutions from verified subject matter experts