

Question: Data (adjacent worksheet) was collected for 45 mutual funds, which are part of the mutual fund portfolios offered through LMD investments. LMD wants to develop
Data (adjacent worksheet) was collected for 45 mutual funds, which are part of the mutual fund portfolios offered through LMD investments. LMD wants to develop a linear regression model to predict the 3-year average return (%) based upon: the fund type, which is denoted as Indexed Funds (IN), Corporate Bonds (CB), Global Equity (GE) and Fixed-income (FI) and the funds Expense ratio. Complete the following steps:
1. Use Excel to construct an (xy) scatterplot for y=3-year average return versus x=Expense ratio. Be sure to provide a meaningful title and informative axis labels.
2. Run the regression model (use IN as the reference category for the categorical variables). Put your regression output in the worksheet "Regression Data". Also generate a proper Normal Probability Plot in the Data worksheet. Use the regression output to answer questions a - h below:
a. Type the estimated regression function.
b. What percentage of the total variability in 3-year average return is explained by the regression model?
c. What is the observed significance level of the estimated regression model?
d. Interpret the estimated regression coefficient for a 'GE' fund.
e. List and explain each independent variables (if any) that is not significant at the 0.05 level
f. State and interpret the 90% confidence interval for the coefficient of 'expense ratio'?
g. Predict the 3-year average return for a GE fund with an Expense ratio of 1.21% (report the final answer to one decimal place).
h. For the given sample data, what is the average marignal value of an 1% increase in the expense ratio on 3-year average returns?
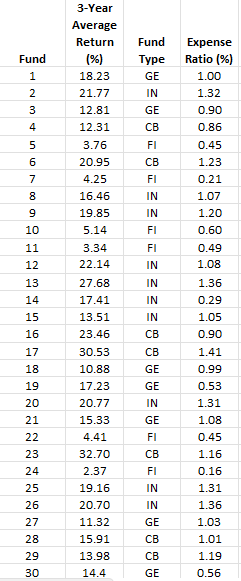
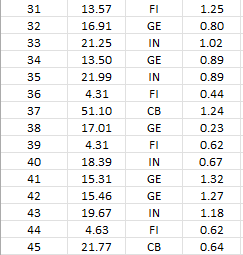
\begin{tabular}{|c|c|c|c|} \hline Fund & 3-YearAverageReturn(%) & FundType & ExpenseRatio(%) \\ \hline 1 & 18.23 & GE & 1.00 \\ \hline 2 & 21.77 & IN & 1.32 \\ \hline 3 & 12.81 & GE & 0.90 \\ \hline 4 & 12.31 & CB & 0.86 \\ \hline 5 & 3.76 & FI & 0.45 \\ \hline 6 & 20.95 & CB & 1.23 \\ \hline 7 & 4.25 & FI & 0.21 \\ \hline 8 & 16.46 & IN & 1.07 \\ \hline 9 & 19.85 & IN & 1.20 \\ \hline 10 & 5.14 & FI & 0.60 \\ \hline 11 & 3.34 & FI & 0.49 \\ \hline 12 & 22.14 & IN & 1.08 \\ \hline 13 & 27.68 & IN & 1.36 \\ \hline 14 & 17.41 & IN & 0.29 \\ \hline 15 & 13.51 & IN & 1.05 \\ \hline 16 & 23.46 & CB & 0.90 \\ \hline 17 & 30.53 & CB & 1.41 \\ \hline 18 & 10.88 & GE & 0.99 \\ \hline 19 & 17.23 & GE & 0.53 \\ \hline 20 & 20.77 & IN & 1.31 \\ \hline 21 & 15.33 & GE & 1.08 \\ \hline 22 & 4.41 & FI & 0.45 \\ \hline 23 & 32.70 & CB & 1.16 \\ \hline 24 & 2.37 & FI & 0.16 \\ \hline 25 & 19.16 & IN & 1.31 \\ \hline 26 & 20.70 & IN & 1.36 \\ \hline 27 & 11.32 & GE & 1.03 \\ \hline 28 & 15.91 & CB & 1.01 \\ \hline 29 & 13.98 & CB & 1.19 \\ \hline 30 & 14.4 & GE & 0.56 \\ \hline \end{tabular} \begin{tabular}{|c|c|c|c|} \hline 31 & 13.57 & FI & 1.25 \\ \hline 32 & 16.91 & GE & 0.80 \\ \hline 33 & 21.25 & IN & 1.02 \\ \hline 34 & 13.50 & GE & 0.89 \\ \hline 35 & 21.99 & IN & 0.89 \\ \hline 36 & 4.31 & FI & 0.44 \\ \hline 37 & 51.10 & CB & 1.24 \\ \hline 38 & 17.01 & GE & 0.23 \\ \hline 39 & 4.31 & FI & 0.62 \\ \hline 40 & 18.39 & IN & 0.67 \\ \hline 41 & 15.31 & GE & 1.32 \\ \hline 42 & 15.46 & GE & 1.27 \\ \hline 43 & 19.67 & IN & 1.18 \\ \hline 44 & 4.63 & FI & 0.62 \\ \hline 45 & 21.77 & CB & 0.64 \\ \hline \end{tabular}
Step by Step Solution
There are 3 Steps involved in it

Get step-by-step solutions from verified subject matter experts