

Question: Data Analyses (20 pts) Create a double line graph to show how each of the following variables change from 2001-2016. You can also create these
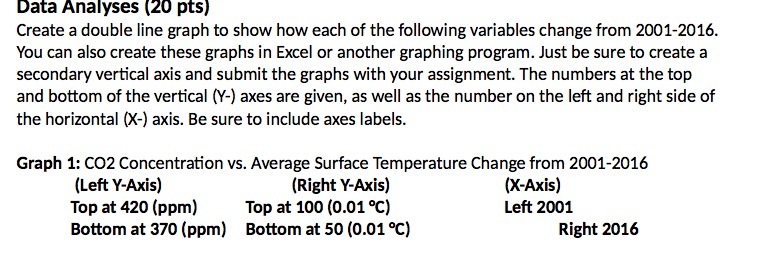
Data Analyses (20 pts) Create a double line graph to show how each of the following variables change from 2001-2016. You can also create these graphs in Excel or another graphing program. Just be sure to create a secondary vertical axis and submit the graphs with your assignment. The numbers at the top and bottom of the vertical (Y-) axes are given, as well as the number on the left and right side of the horizontal (X-) axis. Be sure to include axes labels. Graph 1: CO2 Concentration vs. Average Surface Temperature Change from 2001-2016 (Left Y-Axis) (Right Y-Axis) (X-Axis) Top at 420 (ppm) Top at 100 (0.01 .C) Left 2001 Bottom at 370 (ppm) Bottom at 50 (0.01 .C) Right 2016
Step by Step Solution
There are 3 Steps involved in it

Get step-by-step solutions from verified subject matter experts