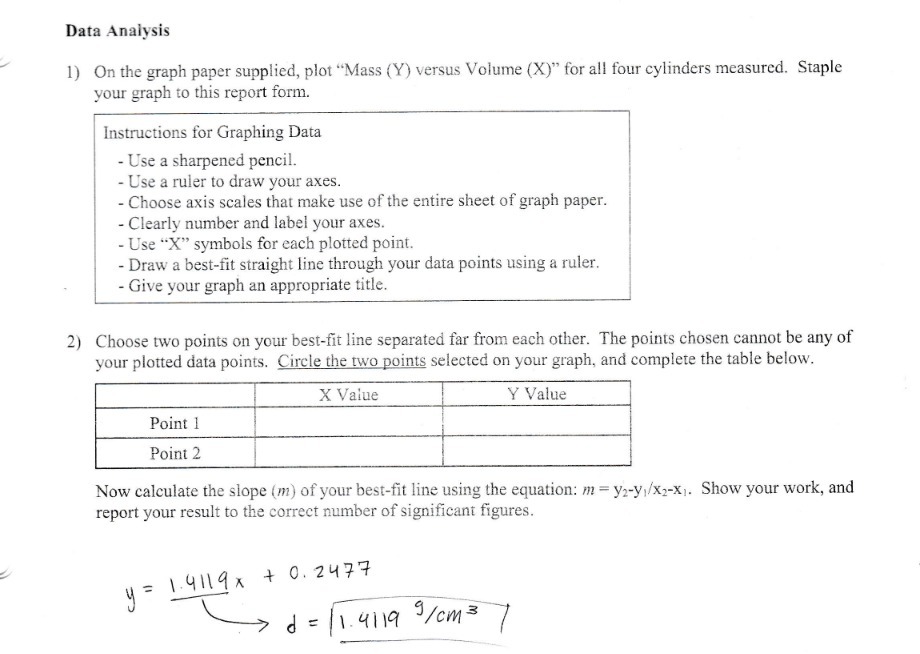
Question: Data Analysis 1) On the graph paper supplied, plot Mass (Y) versus Volume (X) for all four cylinders measured. Staple your graph to this report

Data Analysis 1) On the graph paper supplied,
Data Analysis 1) On the graph paper supplied, plot "Mass (Y) versus Volume (X)" for all four cylinders measured. Staple your graph to this report form. Instructions for Graphing Data - Use a sharpened pencil. - Use a ruler to draw your axes. - Choose axis scales that make use of the entire sheet of graph paper. - Clearly number and label your axes. - Use "X" symbols for each plotted point. - Draw a best-fit straight line through your data points using a ruler. - Give your graph an appropriate title. 2) Choose two points on your best-fit line separated far from each other. The points chosen cannot be any of your plotted data points. Circle the two points selected on your graph, and complete the table below. X Value Y Value Point 1 Point 2 Now calculate the slope (m) of your best-fit line using the equation: m = y2-y,/X2-x1. Show your work, and report your result to the correct number of significant figures. y = 1 91 1 9 x + 0. 2477 d = 1. 4119 9/ cm 3

Step by Step Solution

There are 3 Steps involved in it

1 Expert Approved Answer
Step: 1 Unlock blur-text-image
Question Has Been Solved by an Expert!

Get step-by-step solutions from verified subject matter experts

Step: 2 Unlock
Step: 3 Unlock

Students Have Also Explored These Related Mathematics Questions!