

Question: Data analysis 1. Use the measured data in Tables I to 3 to calculate the measured specific heat (including the average value and deviation) of
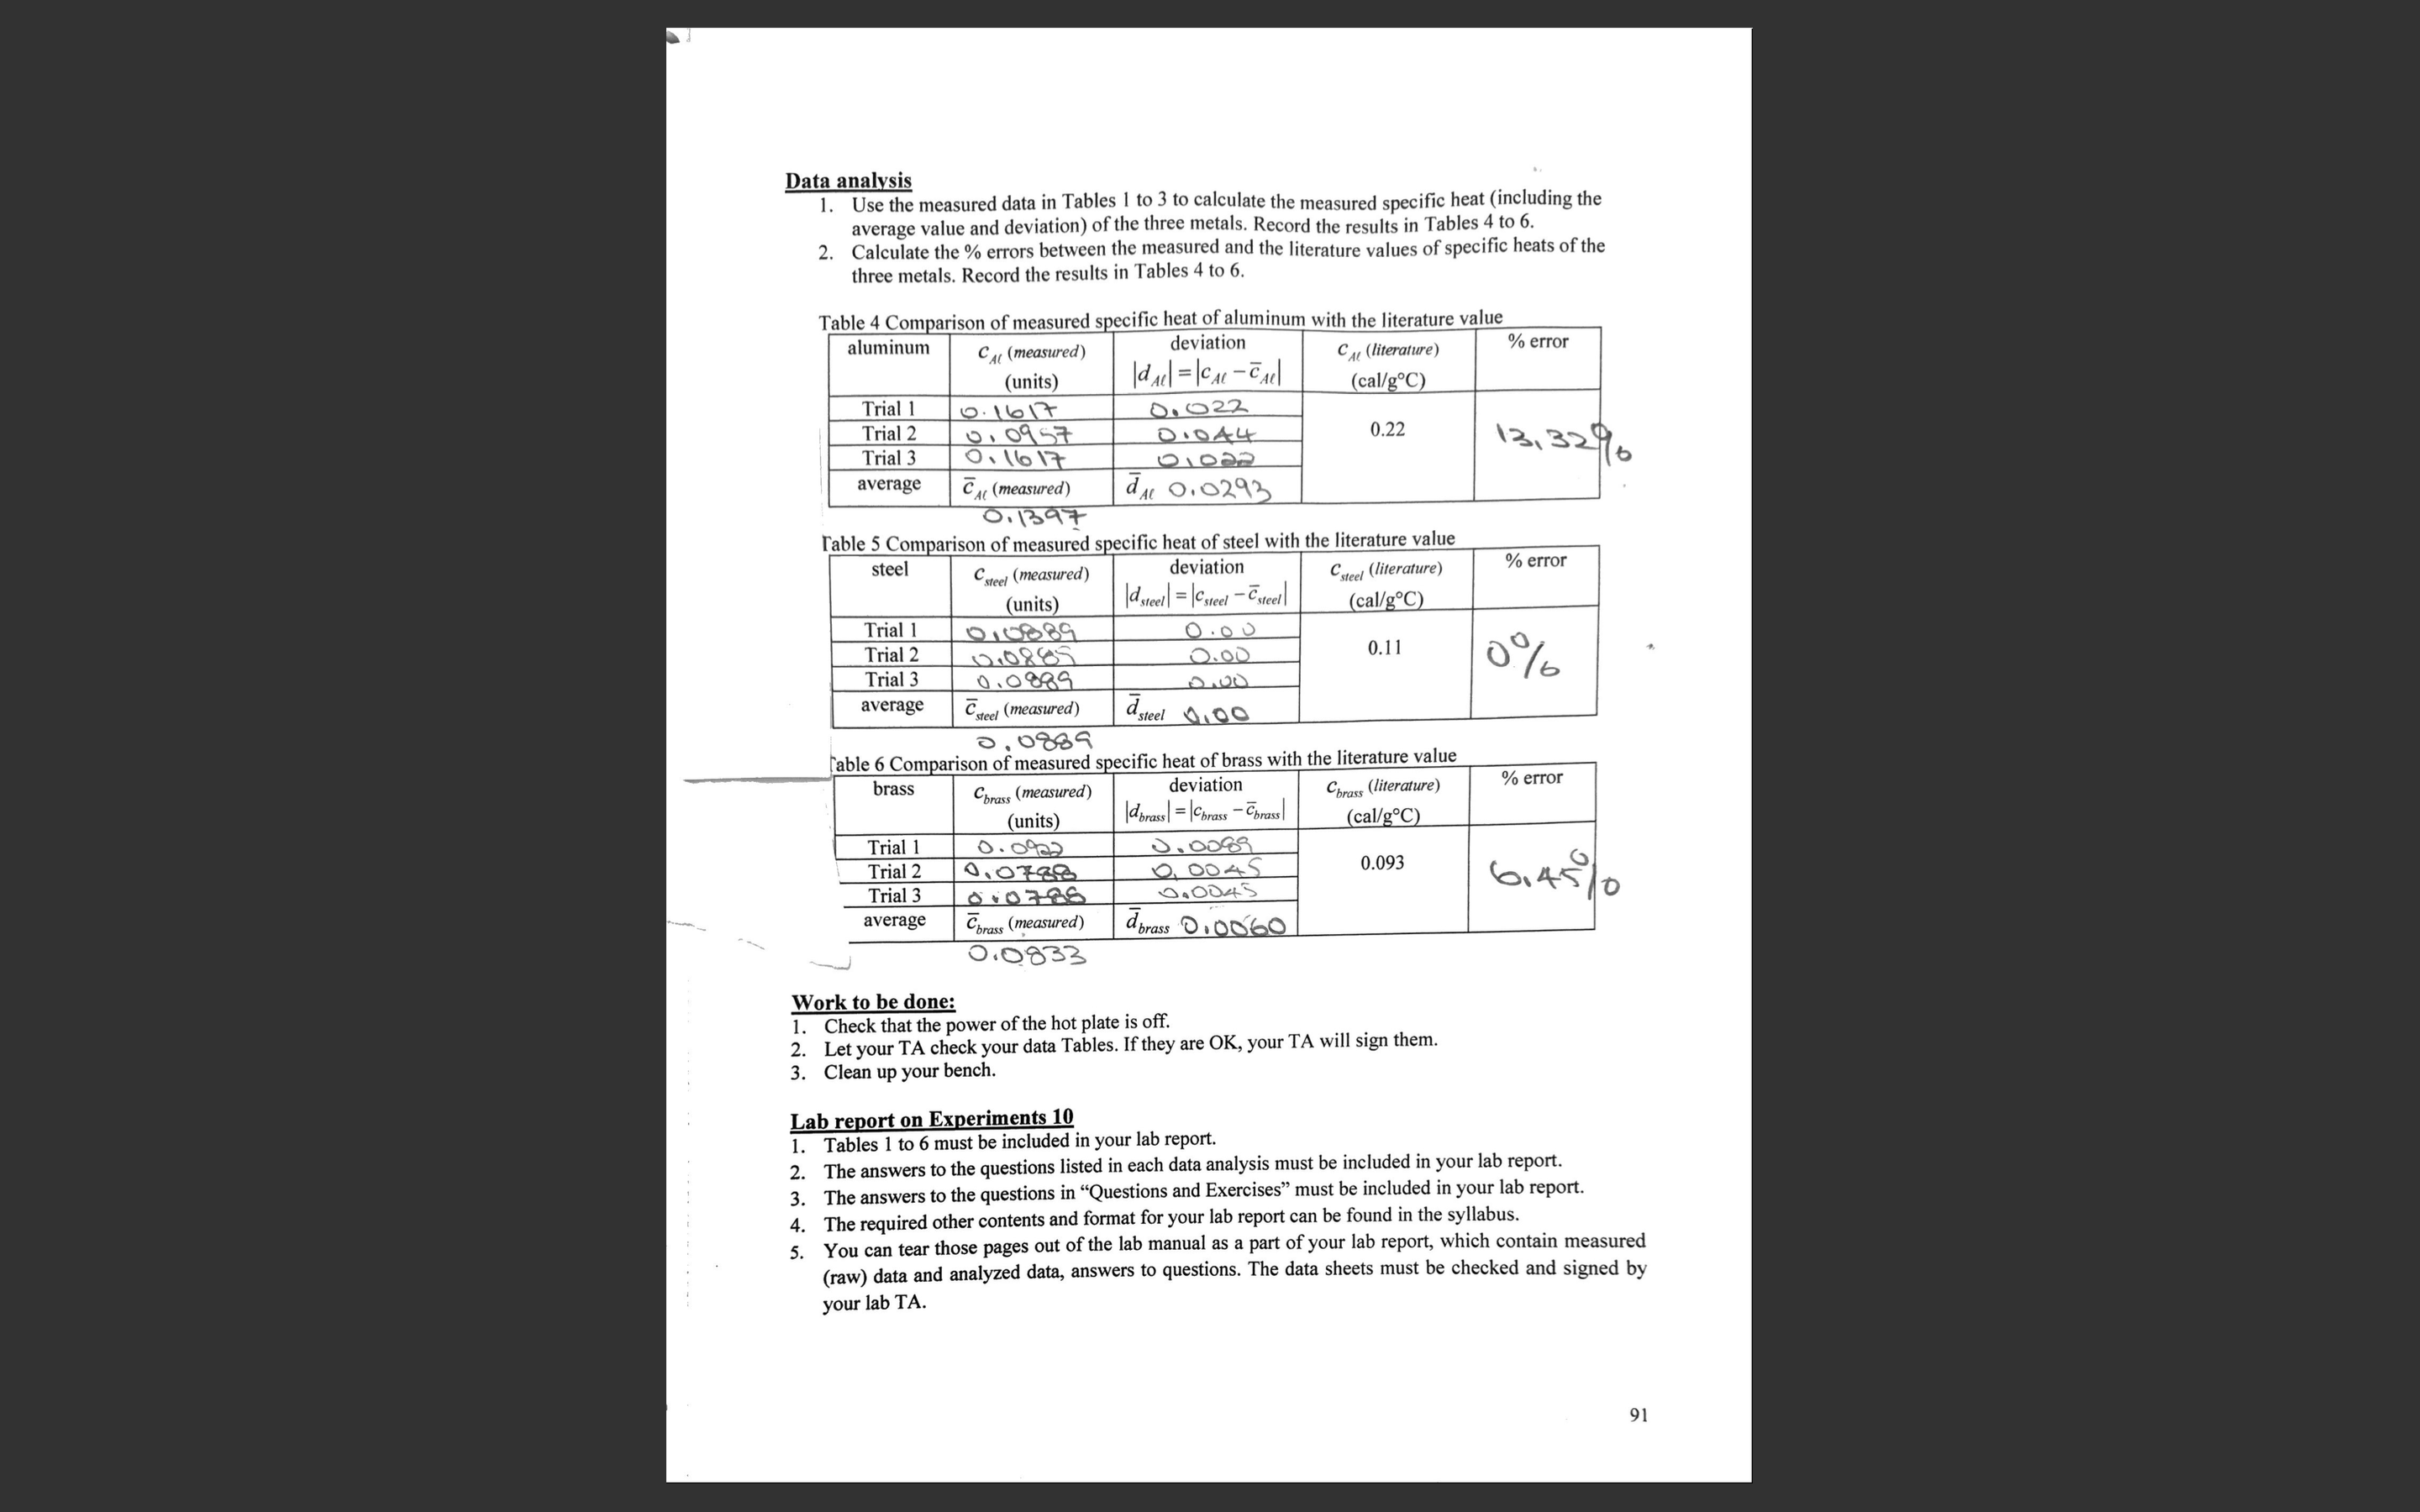
Data analysis 1. Use the measured data in Tables I to 3 to calculate the measured specific heat (including the average value and deviation) of the three metals. Record the results in Tables 4 to 6. 2. Calculate the % errors between the measured and the literature values of specific heats of the three metals. Record the results in Tables 4 to 6. Table 4 Comparison of measured specific heat of aluminum with the literature value aluminum CAL (measured) deviation CAL (literature) % error (units) dAll = CAL - CAl cal/goc) Trial 1 0. 16 17 D. 022 Trial 2 0109 57 D.0 4 4 0.22 Trial 3 0: 16 17 21022 13, 3216 average CAL (measured) dil 0. 0293 D. 1397 Table 5 Comparison of measured specific heat of steel with the literature value steel steel (measured) deviation steel (literature) % error (units) d steel = \\Csteel - Csteel (cal/goC) Trial 1 Trial 2 12.0885 2.00 0.11 Trial 3 0.0880 0 % average CHeel (measured) dsteel 00 5. 0889 Table 6 Comparison of measured specific heat of brass with the literature value brass "brass (measured) deviation Cbrass (literature) % error (units) Idbrass = Cbrass - Cbrass (cal/g.C) Trial 1 0. 0922 Trial 2 010788 2. DOAS 0.093 Trial 3 010786 average Cbrass (measured) dbrass .0060 0.0833 Work to be done 1. Check that the power of the hot plate is off. 2. Let your TA check your data Tables. If they are OK, your TA will sign them. 3. Clean up your bench. Lab report on Experiments 10 Tables 1 to 6 must be included in your lab report. 2. The answers to the questions listed in each data analysis must be included in your lab report. 3. The answers to the questions in "Questions and Exercises" must be included in your lab report. 4. The required other contents and format for your lab report can be found in the syllabus. 5. You can tear those pages out of the lab manual as a part of your lab report, which contain measured (raw) data and analyzed data, answers to questions. The data sheets must be checked and signed by your lab TA. 91
Step by Step Solution
There are 3 Steps involved in it

Get step-by-step solutions from verified subject matter experts