

Question: Data Analysis Age (years Cafeteria Food Rating Grade Point Average Height (inches) 23.05 3-1 6-8-75 Standard Deviation 3.634 1.294 0.729 3.919 17. Given the above
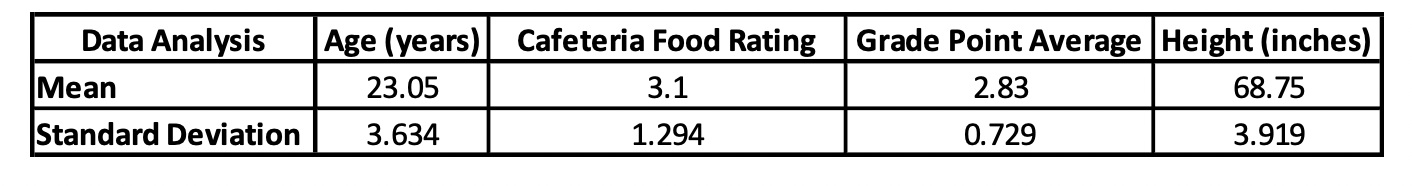


Data Analysis Age (years Cafeteria Food Rating Grade Point Average Height (inches) 23.05 3-1 6-8-75 Standard Deviation 3.634 1.294 0.729 3.919 17. Given the above information for height of the Think Smarter University students determine the minimum sample size needed to construct an 95% confidence interval assuming Scott and Bella want to be within 2% of the population proportion. (5 points)
Step by Step Solution
There are 3 Steps involved in it
1 Expert Approved Answer
Step: 1 Unlock

Question Has Been Solved by an Expert!
Get step-by-step solutions from verified subject matter experts
Step: 2 Unlock
Step: 3 Unlock