

Question: Data analysis and results: Q1 - in P2Q2 sheet, choose any suitable quantitative variable (use the raw data), then: A-compute the three measures of central
- Data analysis and results:
Q1 - in P2Q2 sheet, choose any suitable quantitative variable (use the raw data), then:
A-compute the three measures of central tendency and interpret the values.?
B- compute the skewness values and conclude the data distribution.?
our group Topic: Usage of social media among students.
a) objectives: to study usage of social media among UUM student in daily life wether it is healthy or unhealthy amount of use
b)population of interest: UUM student
c) type of data: primary
reason:
d) variable of interest
i. nominal - type of social media
ii. ordinal - rating by consumer ( frequently used)
iii. interval - percentage of battery consumption after half day
iv. ratio- age of students
---------
Social media is a digital platform becoming quite popular these days and giving chance for people to connect with each other and access information anywhere. But days by days, social media taking a huge toll of people's health. This survey conducted to know either student accesing social media in healthy amount.
1) Gender: Male/ Female
2) Age: 18 - 21 / 22-25/ 25-27
3) Which social media do you use
- Tiktok
4) Which social media you used the most?
- Tiktok
- IG.
5) How many hours in average you spend online daily?
- 4 hours
- 6 hours
-8 hours
- 10 hours
6) how often you procrastinate because of social media ( Very rarely, rarely, moderately, often, very often)
7) What do you use social media for?
-Communication
- Business
- Entertainment
- Studies / Research / Gain information
Variables
i) interval : hours spend online
ii) ratio: age students
iii) nominal: type of social media
iv) ordinal: rating by consumer (procrastination)
----------------
i have to complete my part of group assignment, and my part is to compute the mean median mode for Q1 section A.
And also i have to interpret the measurement too Q1 section B for skewness.
----------
and this is the data of my groupmate that i have to follow up with.
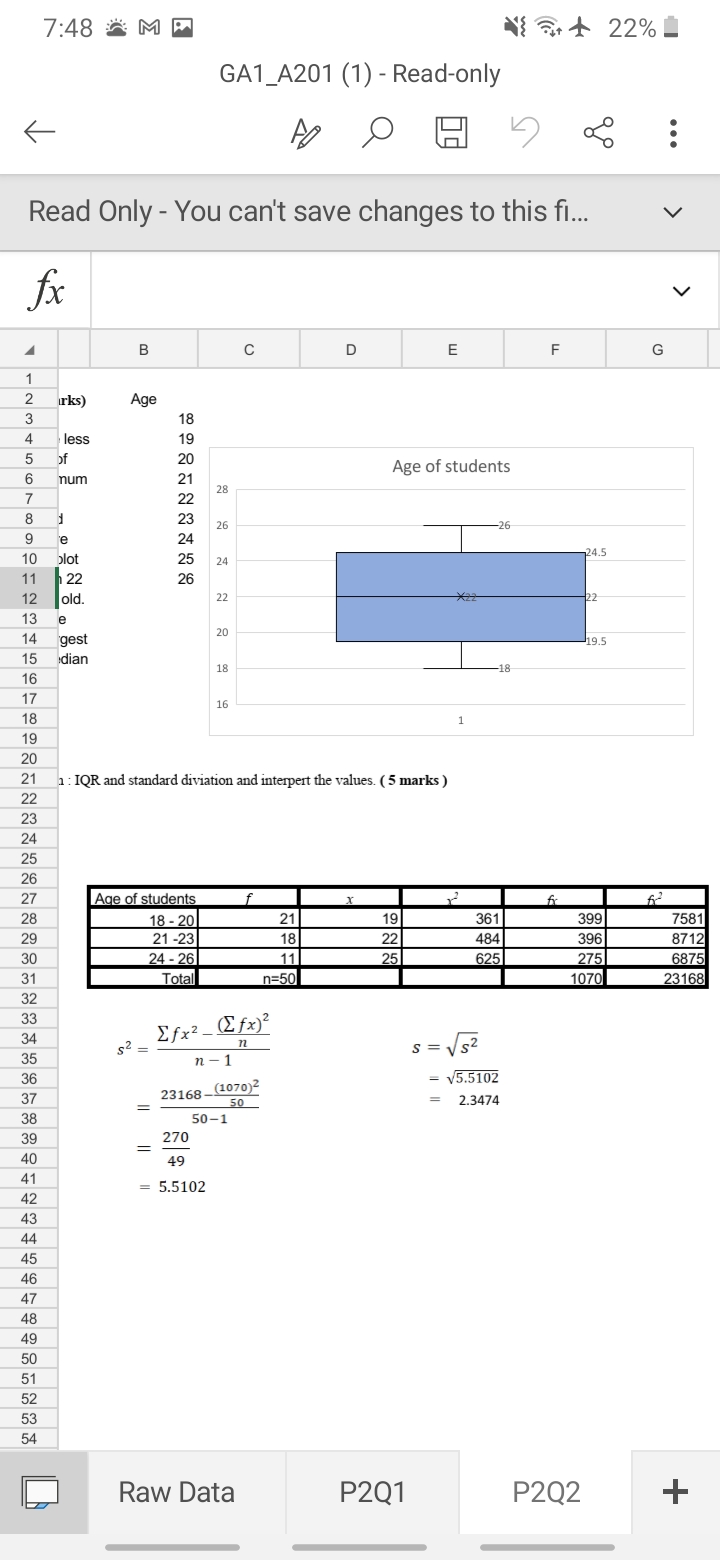
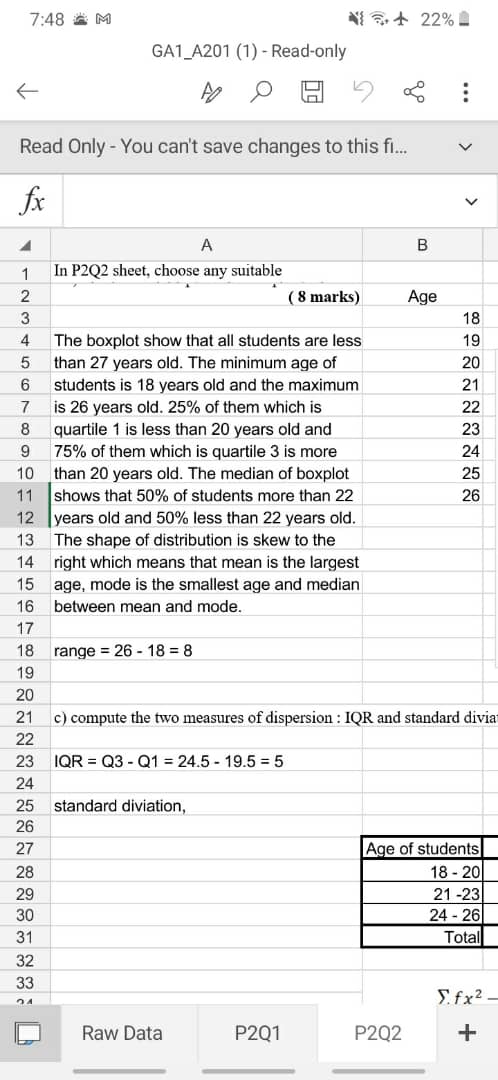
7:48 MP + + 22% GA1_A201 (1) - Read-only . . . Read Only - You can't save changes to this fi... V fx V B C D E F G W N irks) Age 18 4 less 19 20 6 num 21 Age of students 22 28 8 23 26 9 re 24 -26 10 plot 25 24 24.5 11 22 26 12 old. 22 22 13 e 14 gest 20 19.5 15 dian 16 18 -18 17 16 18 1 19 20 21 a : IQR and standard diviation and interpert the values. ( 5 marks ) 22 23 24 25 26 27 Age of students x 62 28 18 - 20 21 19 361 399 7581 29 21 -23 18 22 184 396 3712 30 24 - 26 11 25 625 275 6875 31 Total n=50 1070 23168 32 33 34 Efx2 _ (Efx) 2 n 35 $2 = n - 1 s = VS2 36 23168 _(1070)2 V5.5102 37 50 = 2.3474 38 50-1 39 270 40 49 41 42 = 5.5102 43 44 45 46 47 48 49 50 51 52 53 54 Raw Data P2Q1 P2Q2 +7:48 & M N 3 + 22% GA1_A201 (1) - Read-only Read Only - You can't save changes to this fi.. V fx V A B In P2Q2 sheet, choose any suitable 2 ( 8 marks) Age 3 18 4 The boxplot show that all students are less 19 5 than 27 years old. The minimum age of 20 6 students is 18 years old and the maximum 21 7 is 26 years old. 25% of them which is 22 8 quartile 1 is less than 20 years old and 23 9 75% of them which is quartile 3 is more 24 10 than 20 years old. The median of boxplot 25 11 shows that 50% of students more than 22 26 12 years old and 50% less than 22 years old. 13 The shape of distribution is skew to the 14 right which means that mean is the largest 15 age, mode is the smallest age and median 16 between mean and mode. 17 18 range = 26 - 18 = 8 19 20 21 c) compute the two measures of dispersion : IQR and standard divia 22 23 IQR = Q3 - Q1 = 24.5 - 19.5 = 5 24 25 standard diviation, 26 27 Age of students 28 18 - 20 29 21-23 30 24 - 26 31 Totall 32 33 Efx2 - Raw Data P2Q1 P2Q2 +
Step by Step Solution
There are 3 Steps involved in it

Get step-by-step solutions from verified subject matter experts