

Question: Data Analysis and Visualisations Tasks Visualization 1 How many circuits are available per Country? Visualization 2 What is the number of races per season?
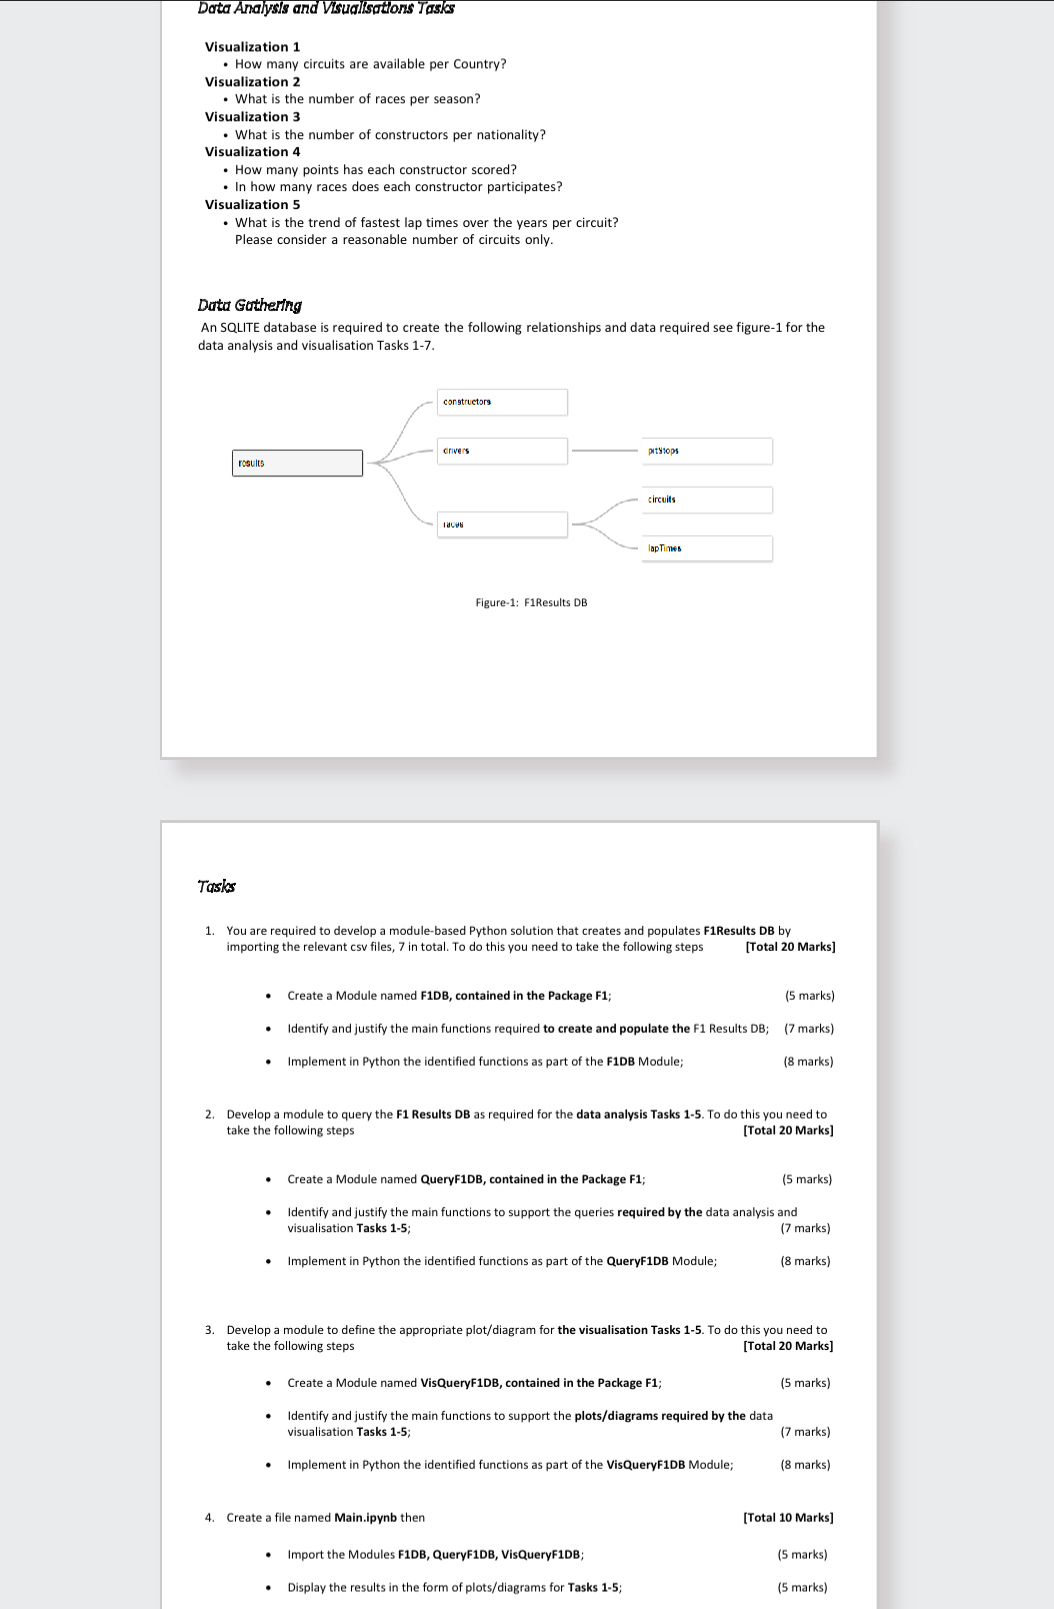
Data Analysis and Visualisations Tasks Visualization 1 How many circuits are available per Country? Visualization 2 What is the number of races per season? Visualization 3 . What is the number of constructors per nationality? Visualization 4 How many points has each constructor scored? In how many races does each constructor participates? Visualization 5 What is the trend of fastest lap times over the years per circuit? Please consider a reasonable number of circuits only. Data Gathering An SQLITE database is required to create the following relationships and data required see figure-1 for the data analysis and visualisation Tasks 1-7. Tasks results . . . constructors drivers 1. You are required to develop a module-based Python solution that creates and populates F1Results DB by importing the relevant csv files, 7 in total. To do this you need to take the following steps [Total 20 Marks] . Ta Figure-1: F1Results DB Create a Module named F1DB, contained in the Package F1; . Identify and justify the main functions required to create and populate the F1 Results DB; pitstops circuits 2. Develop a module to query the F1 Results DB as required for the data analysis Tasks 1-5. To do this you need to take the following steps [Total 20 Marks] lapTimes 4. Create a file named Main.ipynb then Implement in Python the identified functions as part of the F1DB Module; Implement in Python the identified functions as part of the QueryF1DB Module; Create a Module named QueryF1DB, contained in the Package F1; Identify and justify the main functions to support the queries required by the data analysis and visualisation Tasks 1-5; (7 marks) (8 marks) 3. Develop a module to define the appropriate plot/diagram for the visualisation Tasks 1-5. To do this you need to take the following steps [Total 20 Marks] (5 marks) Import the Modules F1DB, QueryF1DB, VisQueryF1DB; Display the results in the form of plots/diagrams for Tasks 1-5; (5 marks) (7 marks) (8 marks) Create a Module named VisQueryF1DB, contained in the Package F1; Identify and justify the main functions to support the plots/diagrams required by the data visualisation Tasks 1-5; Implement in Python the identified functions as part of the VisQueryF1DB Module; (5 marks) (7 marks) (8 marks) [Total 10 Marks] (5 marks) (5 marks)
Step by Step Solution
There are 3 Steps involved in it

Get step-by-step solutions from verified subject matter experts