

Question: data analysis, answer all parts STOP saying it needs more details, instructions are very clear use the figures to answer the following Questions A-H The
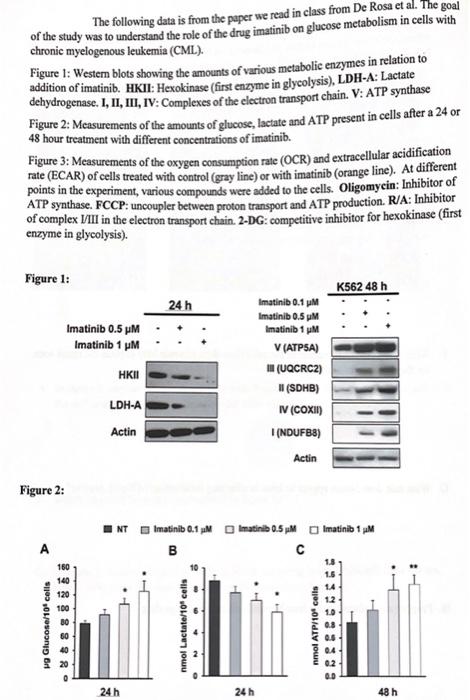
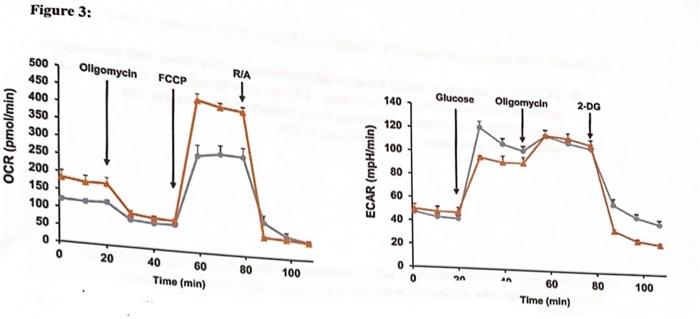
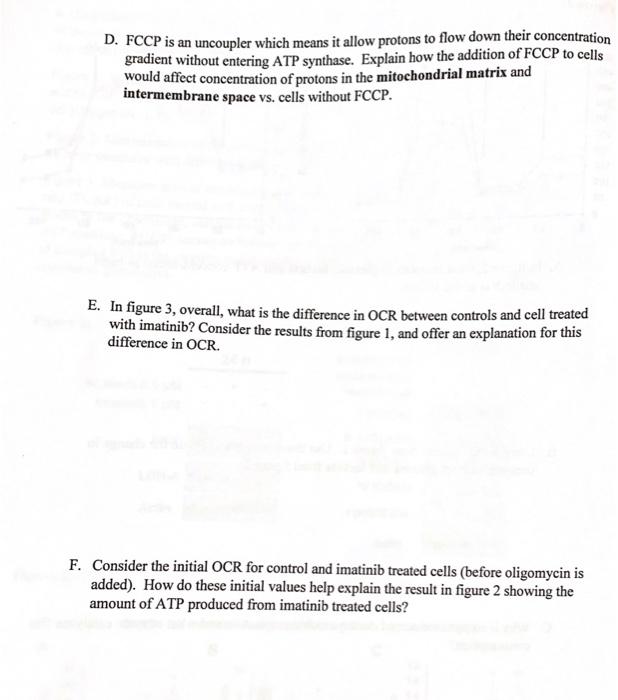
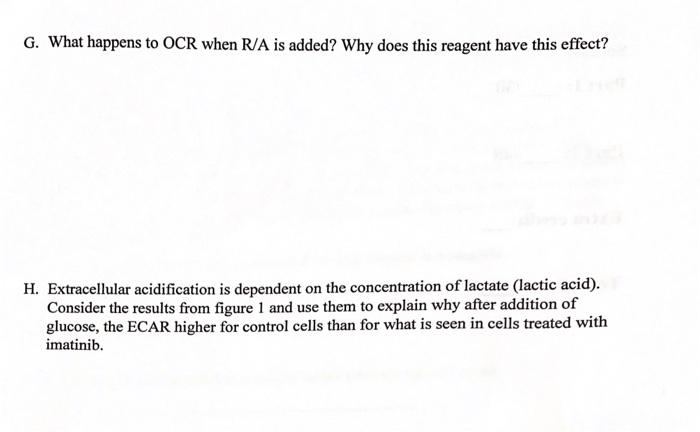
The following data is from the paper we read in class from De Rosa et al. The goal of the study was to understand the role of the drug imatinib on glucose metabolism in cells with chronic myelogenous leukemia (CML). Figure 1: Western blots showing the amounts of various metabolic enzymes in relation to addition of imatinib. HKII: Hexokinase (first enzyme in glycolysis), LDH-A: Lactate dehydrogenase. 1, 11, II, IV: Complexes of the electron transport chain. V: ATP synthase Figure 2: Measurements of the amounts of glucose, lactate and ATP present in cells after a 24 or 48 hour treatment with different concentrations of imatinib. Figure 3: Measurements of the oxygen consumption rate (OCR) and extracellular acidification rate (ECAR) of cells treated with control (gray line) or with imatinib (orange line). At different points in the experiment, various compounds were added to the cells. Oligomycin: Inhibitor of ATP synthase. FCCP: uncoupler between proton transport and ATP production. R/A: Inhibitor of complex VIII in the electron transport chain. 2-DG:competitive inhibitor for hexokinase (first enzyme in glycolysis). Figure 1: K562 48 h 24 h Imatinib 0.5 MM Imatinib 1 PM HKU Imatinib 0.1 MM Imatinib 0.5 M Imatinib 1 M V (ATPSA) IN (UQCRC2) (SDHB) IV (COXI (NDUFB8) LDH-A Actin Actin Figure 2: NT Imatinib 0.1 mM Imatinib 0.5 M Imatinib 1 M B A 60 160 140 120 100 1.3 1.6 14 wg Glucose/10' cells .888888 nmol Lactate/109 cells 10 . 4 2 nmol ATP/109 cells BURBE5555 0.2 0.0 24h 24 h 48 h Figure 3: Oligomycin FCCP RIA 140 Glucose Ollgomycin 2-DG 500 450 400 350 300 250 200 150 120 100 80 60 40 100 50 0 0 20 20 40 60 0 80 100 Time (min) O an 60 80 100 Time (min) D. FCCP is an uncoupler which means it allow protons to flow down their concentration gradient without entering ATP synthase. Explain how the addition of FCCP to cells would affect concentration of protons in the mitochondrial matrix and intermembrane space vs. cells without FCCP. E. In figure 3, overall, what is the difference in OCR between controls and cell treated with imatinib? Consider the results from figure 1, and offer an explanation for this difference in OCR F. Consider the initial OCR for control and imatinib treated cells (before oligomycin is added). How do these initial values help explain the result in figure 2 showing the amount of ATP produced from imatinib treated cells? G. What happens to OCR when R/A is added? Why does this reagent have this effect? H. Extracellular acidification is dependent on the concentration of lactate (lactic acid). Consider the results from figure 1 and use them to explain why after addition of glucose, the ECAR higher for control cells than for what is seen in cells treated with imatinib
Step by Step Solution
There are 3 Steps involved in it

Get step-by-step solutions from verified subject matter experts